For the longest time, we didn’t have any information about what the actual minimum requirements to run PSPDFKit Server were. We made some informed guesses, but there was no data backing them up. Furthermore, we had no information about how PSPDFKit Server behaves when under a heavy load, since that’s not something our usual test suite and prerelease HAT testing covers.
So, we decided it was time to perform load testing on PSPDFKit Server. And today I want to talk about how we tested how PSPDFKit Server performs under load and how we used this information to improve the hardware recommendations we make to our customers.
The Testing Environment
First, to run our load tests, we needed a basic PSPDFKit Server setup consisting of:
-
A machine running PSPDFKit Server
-
A machine running a PostgresSQL instance
Many of our customers use AWS to run their infrastructure, so we decided we’d also use AWS for our load testing. That meant setting up an EC2 instance for running PSPDFKit Server and an RDS instance for the DB. We used Terraform to set up and manage our test infrastructure, and this allowed us to switch instance sizes directly from our developer machines. It also meant that we could have everything required for running load testing in our Git repo. Furthermore, since PSPDFKit Server is shipped as a Docker image, we used ECS to actually run it.
That being said, I won’t go into any more details on the actual setup here, but having an easily configurable setup allowed us to experiment with the following:
-
Burstable vs. non-burstable instances
-
Having more memory vs. having more CPU available
-
Running on Intel vs. running on ARM
-
How tuning the environment variables PSPDFKit Server exposes affects performance
Next up, let’s look at how the tests actually worked.
How We Ran the Tests
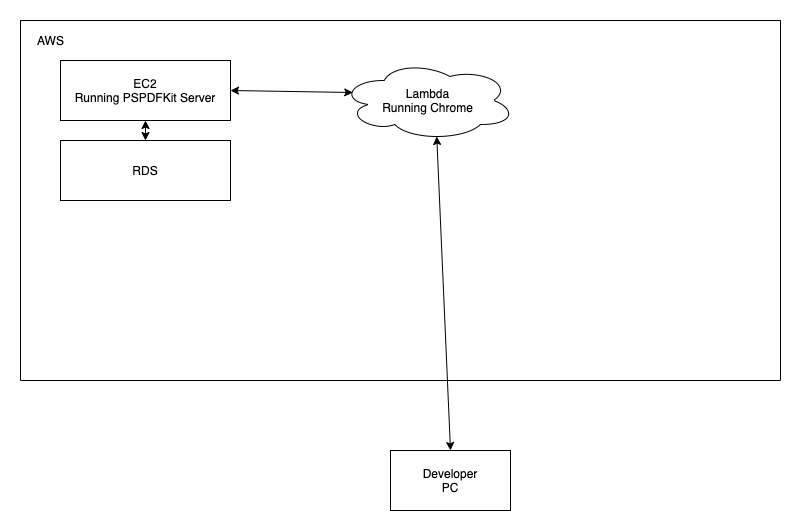
First, here’s a general outline of how our load tests are set up:

Inside AWS, we have an EC2 instance running PSPDFKit Server. It communicates with both our DB running on RDS and a Lambda function running headless Chrome. The developer’s PC outside of AWS communicates with the Lambda function.
Now I’ll discuss how we actually generate the load.
Load Generation
One of the most resource-intensive use cases handled by PSPDFKit Server is loading and rendering PDF documents for users as they open the web viewer, and we decided we wanted to test this in the most realistic way possible. This meant having actual browser instances loading documents from our PSPDFKit Server instance and measuring how long it takes until the first page is fully rendered.
There are existing load testing solutions such as locust.io. However, this wasn’t suitable for our case since we wanted to use AWS Lambda for scaling, and we required a browser for testing. So, we decided to build a tool ourselves. This tool has two parts:
-
A serverless function deployed on AWS Lambda
-
A script the developer can run on their machine to kick off the load test and gather results
First let’s look at our serverless function.
Serverless Function
Using serverless, we could easily develop a function to deploy on AWS Lambda that uses Puppeteer and chrome-aws-lambda to start a headless Chromium instance. The key advantage of this approach is that, as we send more requests, AWS Lambda seamlessly offers us more compute and network resources, allowing us to scale up the load as high as we need. The way this function works is as follows:
-
Our orchestration script calls the Lambda function, passing it a document ID to navigate to.
-
The function starts a headless instance of Chromium using Puppeteer.
-
It navigates to the document on our PSPDFKit Server instance, and it waits until the page is fully rendered.
-
After the page is fully rendered, the amount of time it took is sent back to the orchestration script. If there was an error loading the page, that’s also reported.
Here’s an early version of this function:
// This module will be provided by the layer.
const chromium = require('chrome-aws-lambda');

function timestamp() {
	const [seconds, nanos] = process.hrtime();
	return seconds * 1000 + nanos / 1000000;
}

exports.handler = async (event) => {
	const { url, username, password } = event.queryStringParameters;

	// Launch a headless browser.
	const browser = await chromium.puppeteer.launch({
		args: chromium.args,
		defaultViewport: chromium.defaultViewport,
		executablePath: await chromium.executablePath,
		headless: chromium.headless,
		ignoreHTTPSErrors: true,
	});

	const page = await browser.newPage();

	// Our load testing server uses basic auth.
	await page.authenticate({ username: username, password: password });
	await page.goto(url, { waitUntil: 'load' });

	const startTime = timestamp();

	await page.waitForFunction(() => {
		// Wait until the page text is part of the DOM.
		return (
			window.frames[0] != null &&
			window.frames[0].document.querySelector('.PSPDFKit-Text') != null
		);
	});

	const endTime = timestamp();

	// If we don't do this, Lambda might break randomly.
	if (browser !== null) {
		await browser.close();
	}

	return {
		statusCode: 200,
		body: JSON.stringify({
			time: endTime - startTime,
		}),
	};
};
Our final version uses a more sophisticated heuristic for determining when the page has fully loaded, but the core ideas are the same: Open the browser, load the page, and return some timing information.
As for deployment, since we’re using the serverless SDK, deployment involves calling serverless deploy, and with that, part one of our load testing setup is done.
Next up, we’ll look at the orchestration script.
The Orchestrator
The second part is the script the developer runs on their machine to kick off the load testing and collect and aggregate the data. This script has multiple jobs:
-
Ensures that our EC2 instances and RDS instances are started and stopped (because we didn’t want our AWS infrastructure to be running 24/7)
-
Triggers the Lambda function and collects the data
-
Outputs the data as a CSV for additional processing and analyzing
For this, we used Node.js and the AWS SDK for JavaScript.
The AWS SDK made it easy to query the state of our EC2 and RDS instances and start and stop them as part of our load testing script. Apart from that, the script calls our Lambda function a set amount of times, with a set amount of time between each call. We do this so we can see how PSPDFKit Server behaves with a constant stream of requests. For each request, we track when we start it, when we end it, and the time it took to render the full first page — or nothing if there was an error. Finally, we output this as a CSV file containing all the stats for each request.
Here’s some pseudocode to give you an idea of how this looks:
start_aws_services()

while current_request < request_count do
    document_id = get_random_document_id()
    running_requests += load_document(document_id)
    current_request++
    sleep(time_between_requests)
end

await all(running_requests)

write_stats_to_csv()

stop_aws_services()
And here’s how our final output looks:
startTime,endTime,documentId,reportedTime
...
63241.76912879944,77968.09527397156,7KPS82MBKRRN7VES30YMHR6MF7,13578.246370999608
63845.43104505539,93009.25501298904,7KPV6JR554MBXRGWZCJ9C1DCM3,-1
...
Let’s walk through everything we track:
-
startTimeandendTime— This tells us when the request was triggered and when it was finished. This doesn’t necessarily match up withreportedTimesince it includes the overhead of calling the Lambda function. -
documentId— We track the document that was fetched. This allows us to determine if errors were caused by the load or if they’re document-specific issues. -
reportedTime— This is the time that the Lambda function reported it took to render the first page. In cases where the page didn’t render due to an error or a timeout, we tracked a-1to indicate an error with the document loading.
Using this information, we can determine the median response time and the failure rate. When running the tests, we made sure that each test run used the same documents in the same order. In this way, results between tests were comparable.
Now, let’s look at how we used this data and what actions we were able to take.
Results
After we had everything set up, it was time to gather some data. We ran many tests, but I’ll share a few of the more interesting findings, in no particular order:
-
PDF rendering using PSPDFKit Server performs the same on Graviton2 (ARM)-based instances as it does on Intel-based ones.
-
PSPDFKit Server comes with many configuration options. During testing, we experimented with how changing them affects performance, and we found that you can measurably improve performance by tweaking them.
-
In its default configuration, PSPDFKit Server doesn’t make full use of the available system memory for caching. This means we can let customers know that if they change the configuration slightly, they can improve performance.
These are just a handful of the things we discovered, but it shows what you can miss if you don’t test your software under a real load. We used this information to update our configuration guides, and we optimized the defaults in our code based on the findings.
Using the data we collected, we were also able to establish a baseline of hardware requirements. In turn, we included that information in our Server Resource Requirements guide.
Conclusion
I hope this gave you an overview of how we set up our load testing infrastructure and how it can be used to improve not only the performance of your software, but also the documentation you ship to your customers. This isn’t something we run for every pull request, but it’s a useful tool to have in our arsenal for validating bigger changes and ensuring performance doesn’t regress between releases.


