
Running production systems requires constant observation to make sure they don’t underperform or behave unexpectedly. And to gain insight into a system’s performance, metrics are one of the most important tools you can have.
Since its first release, PSPDFKit Server has been packaged as a Docker container. This means it’s always been possible to monitor it using standardized container tooling: Observing system-level metrics like CPU and memory consumption, network and disk I/O throughput, and disk usage is supported both by major cloud providers and open source solutions.
However, while these metrics allow you to see if there’s something wrong in the system, often they don’t provide you with the whole picture. We’ve experienced this firsthand when helping our customers address production issues — while ultimately it’s been possible to get to the root of the problem, it wasn’t as easy as it could’ve been. These situations require more specific metrics — metrics which can be only exposed directly from an application.
That’s why with PSPDFKit Server 2020.5.0, we introduced the ability to export application metrics, which provide more fine-grained insight into PSPDFKit Server’s performance. These metrics allow you to track baseline performance and identify issues more quickly and with better precision. In this blog post, we’ll explore some of these new capabilities, highlighting a few of the most useful metrics to track.
Queues All the Way Down
From our experience, and based on feedback from our customers, two components of PSPDFKit Server are the biggest factors in user-perceived performance: the PostgreSQL database client, and the internal PDF processing engine.
PostgreSQL is a reliable piece of software, and it provides many server-side metrics on its own. However, these metrics don’t tell you anything about how the performance looks from the Postgres client perspective. Meanwhile, PDF processing — an internal part of PSPDFKit Server transparent to its users and operators — could not be monitored at all.
This has changed, and Server now exposes both queue time and query time metrics for PostgreSQL queries and queue time and execution time metrics for PDF processing.
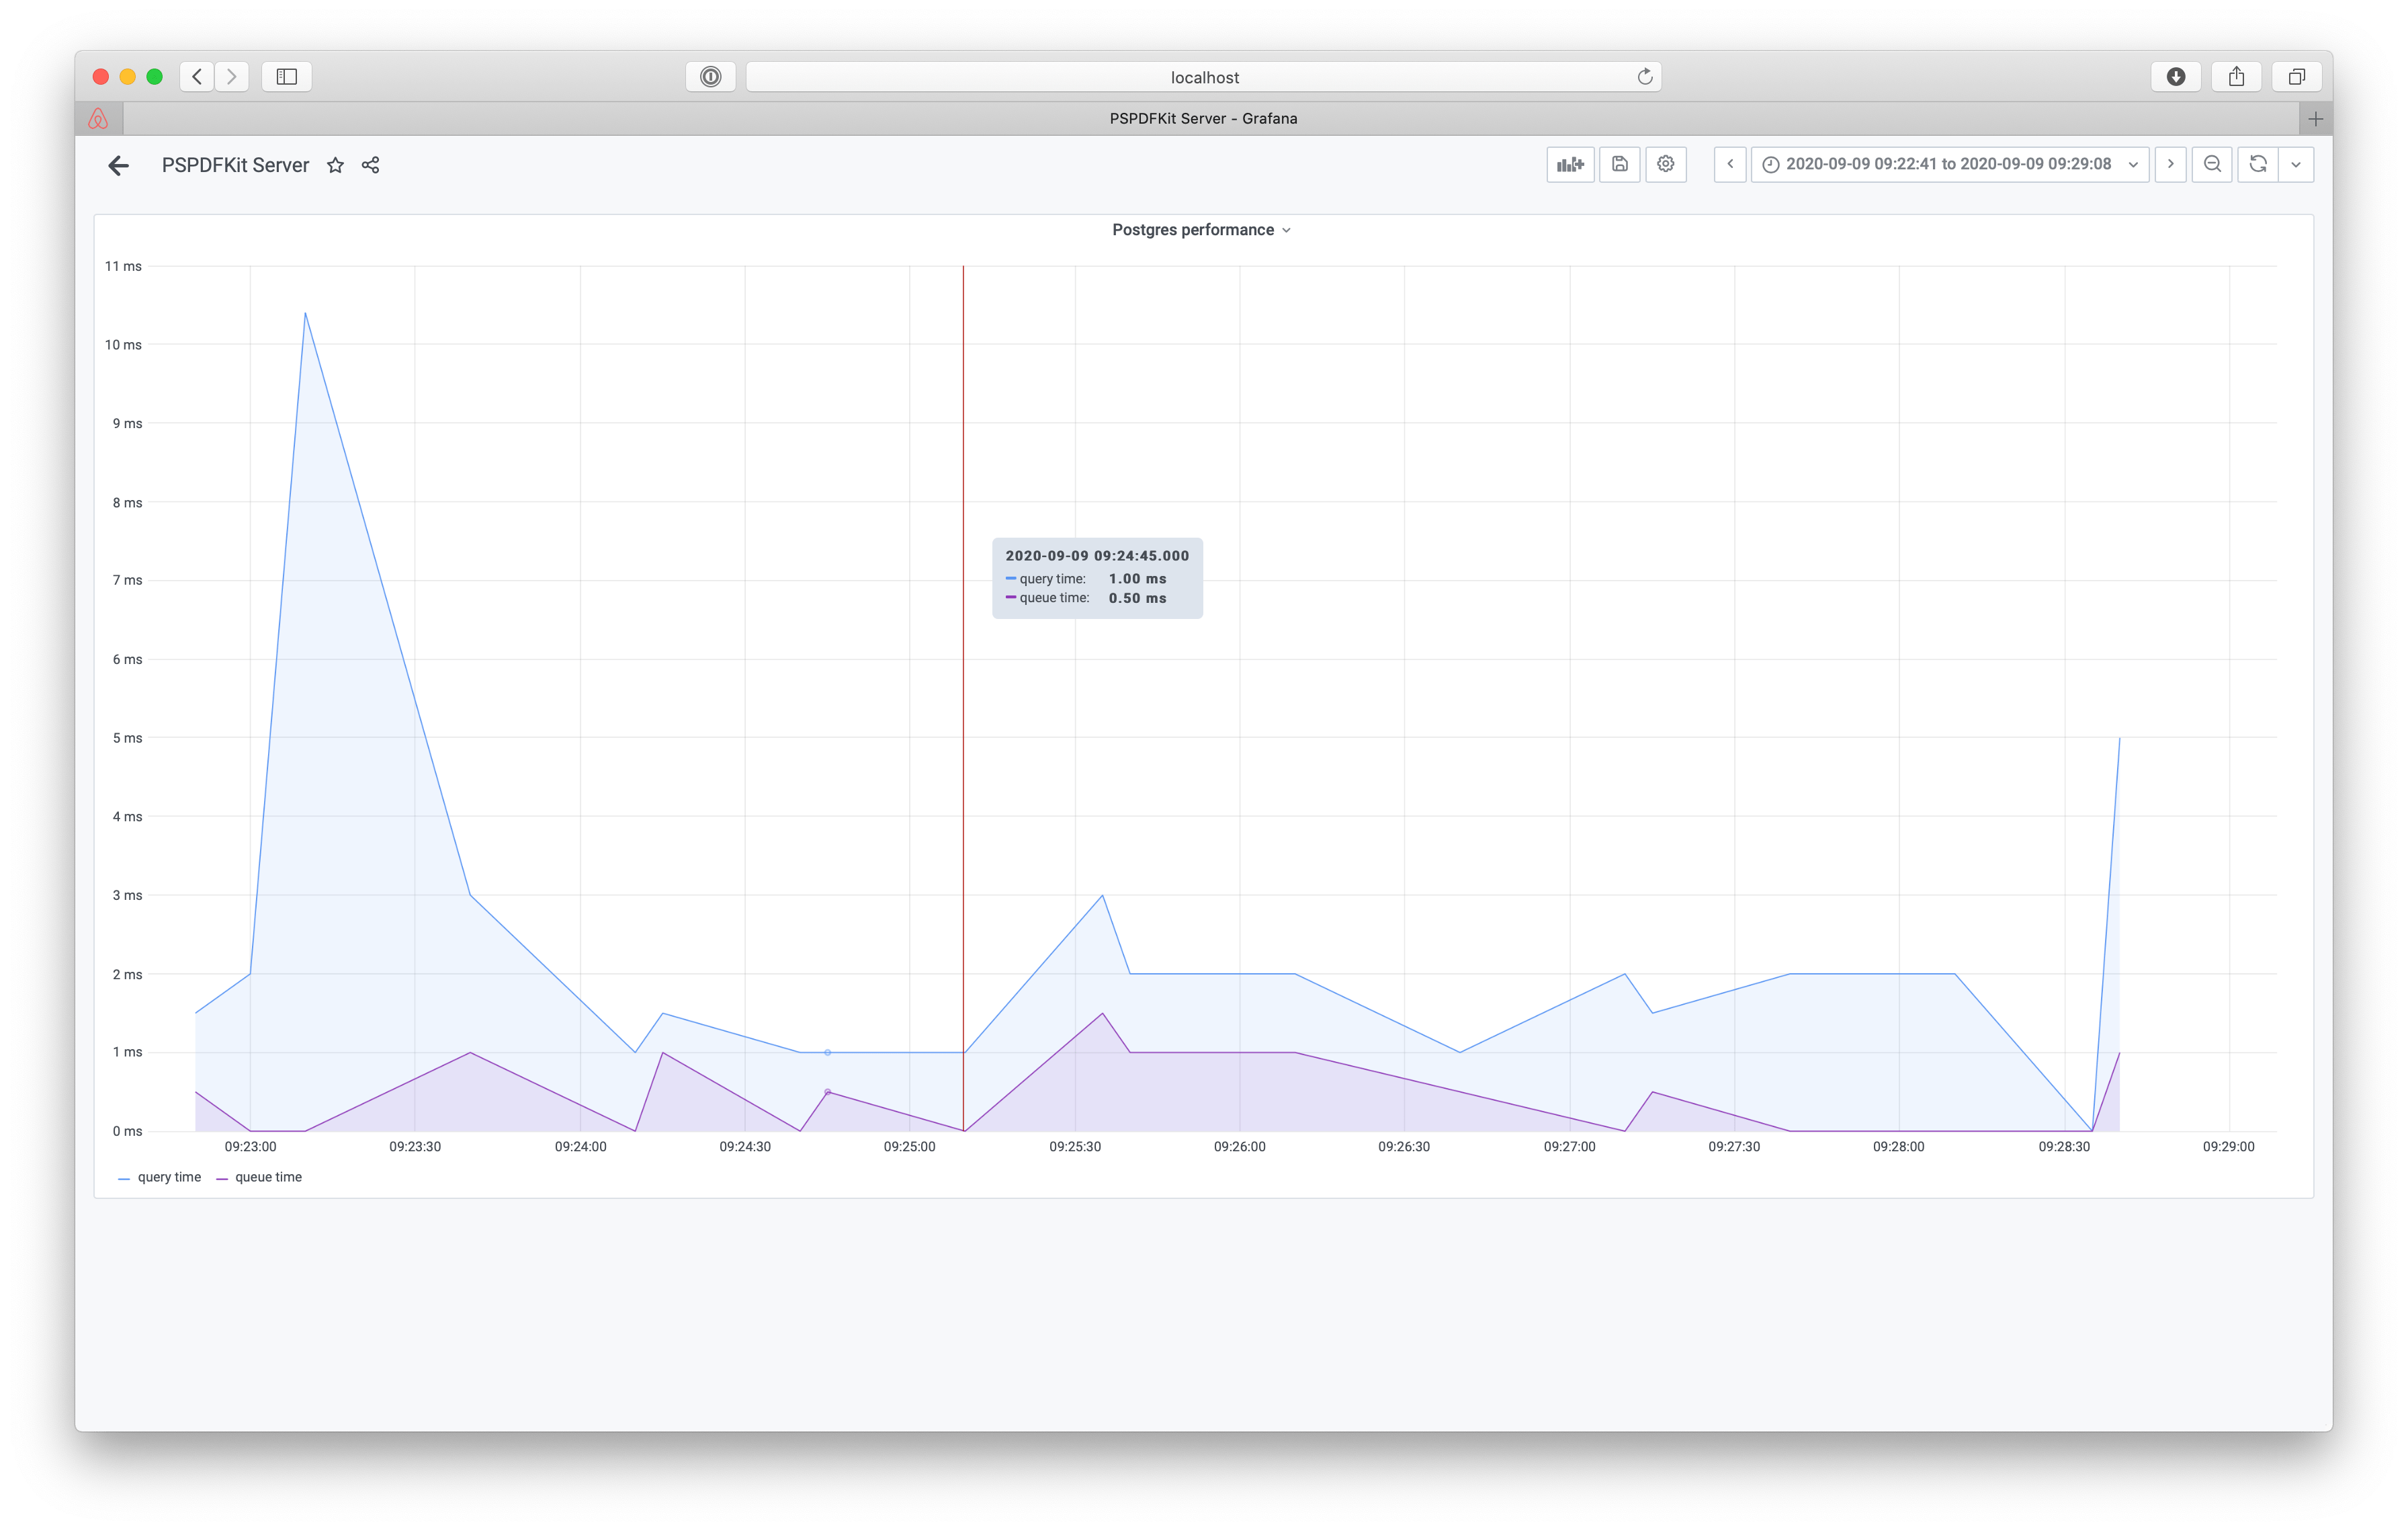
While it’s common to only track query time, the query time alone isn’t sufficient. We can learn from it that a lot of time is spent on database interaction and use it to increase the size of our database instance to make it faster. However, users can still experience bad performance even when the query time is low — if there are many requests claiming the database connection, they’ll queue up and wait until the connection is available. The queue time can serve as an indicator to tune the database pool size with the DATABASE_CONNECTIONS configuration variable or to spin up more PSPDFKit Server instances.
To Cache or Not to Cache
Most of the functionality exposed by PSPDFKit Server requires access to uploaded PDF files. Getting files from the asset storage every time they’re needed would take a lot of time, which is why Server uses a file system cache to keep the PDFs accessed most often on the disk. You could always control the size of that cache using the ASSET_STORAGE_CACHE_SIZE configuration option, but previously, it wasn’t possible to tell if the number you picked was sufficient for your needs.
That’s why with this first iteration, we’re also introducing file system cache metrics.
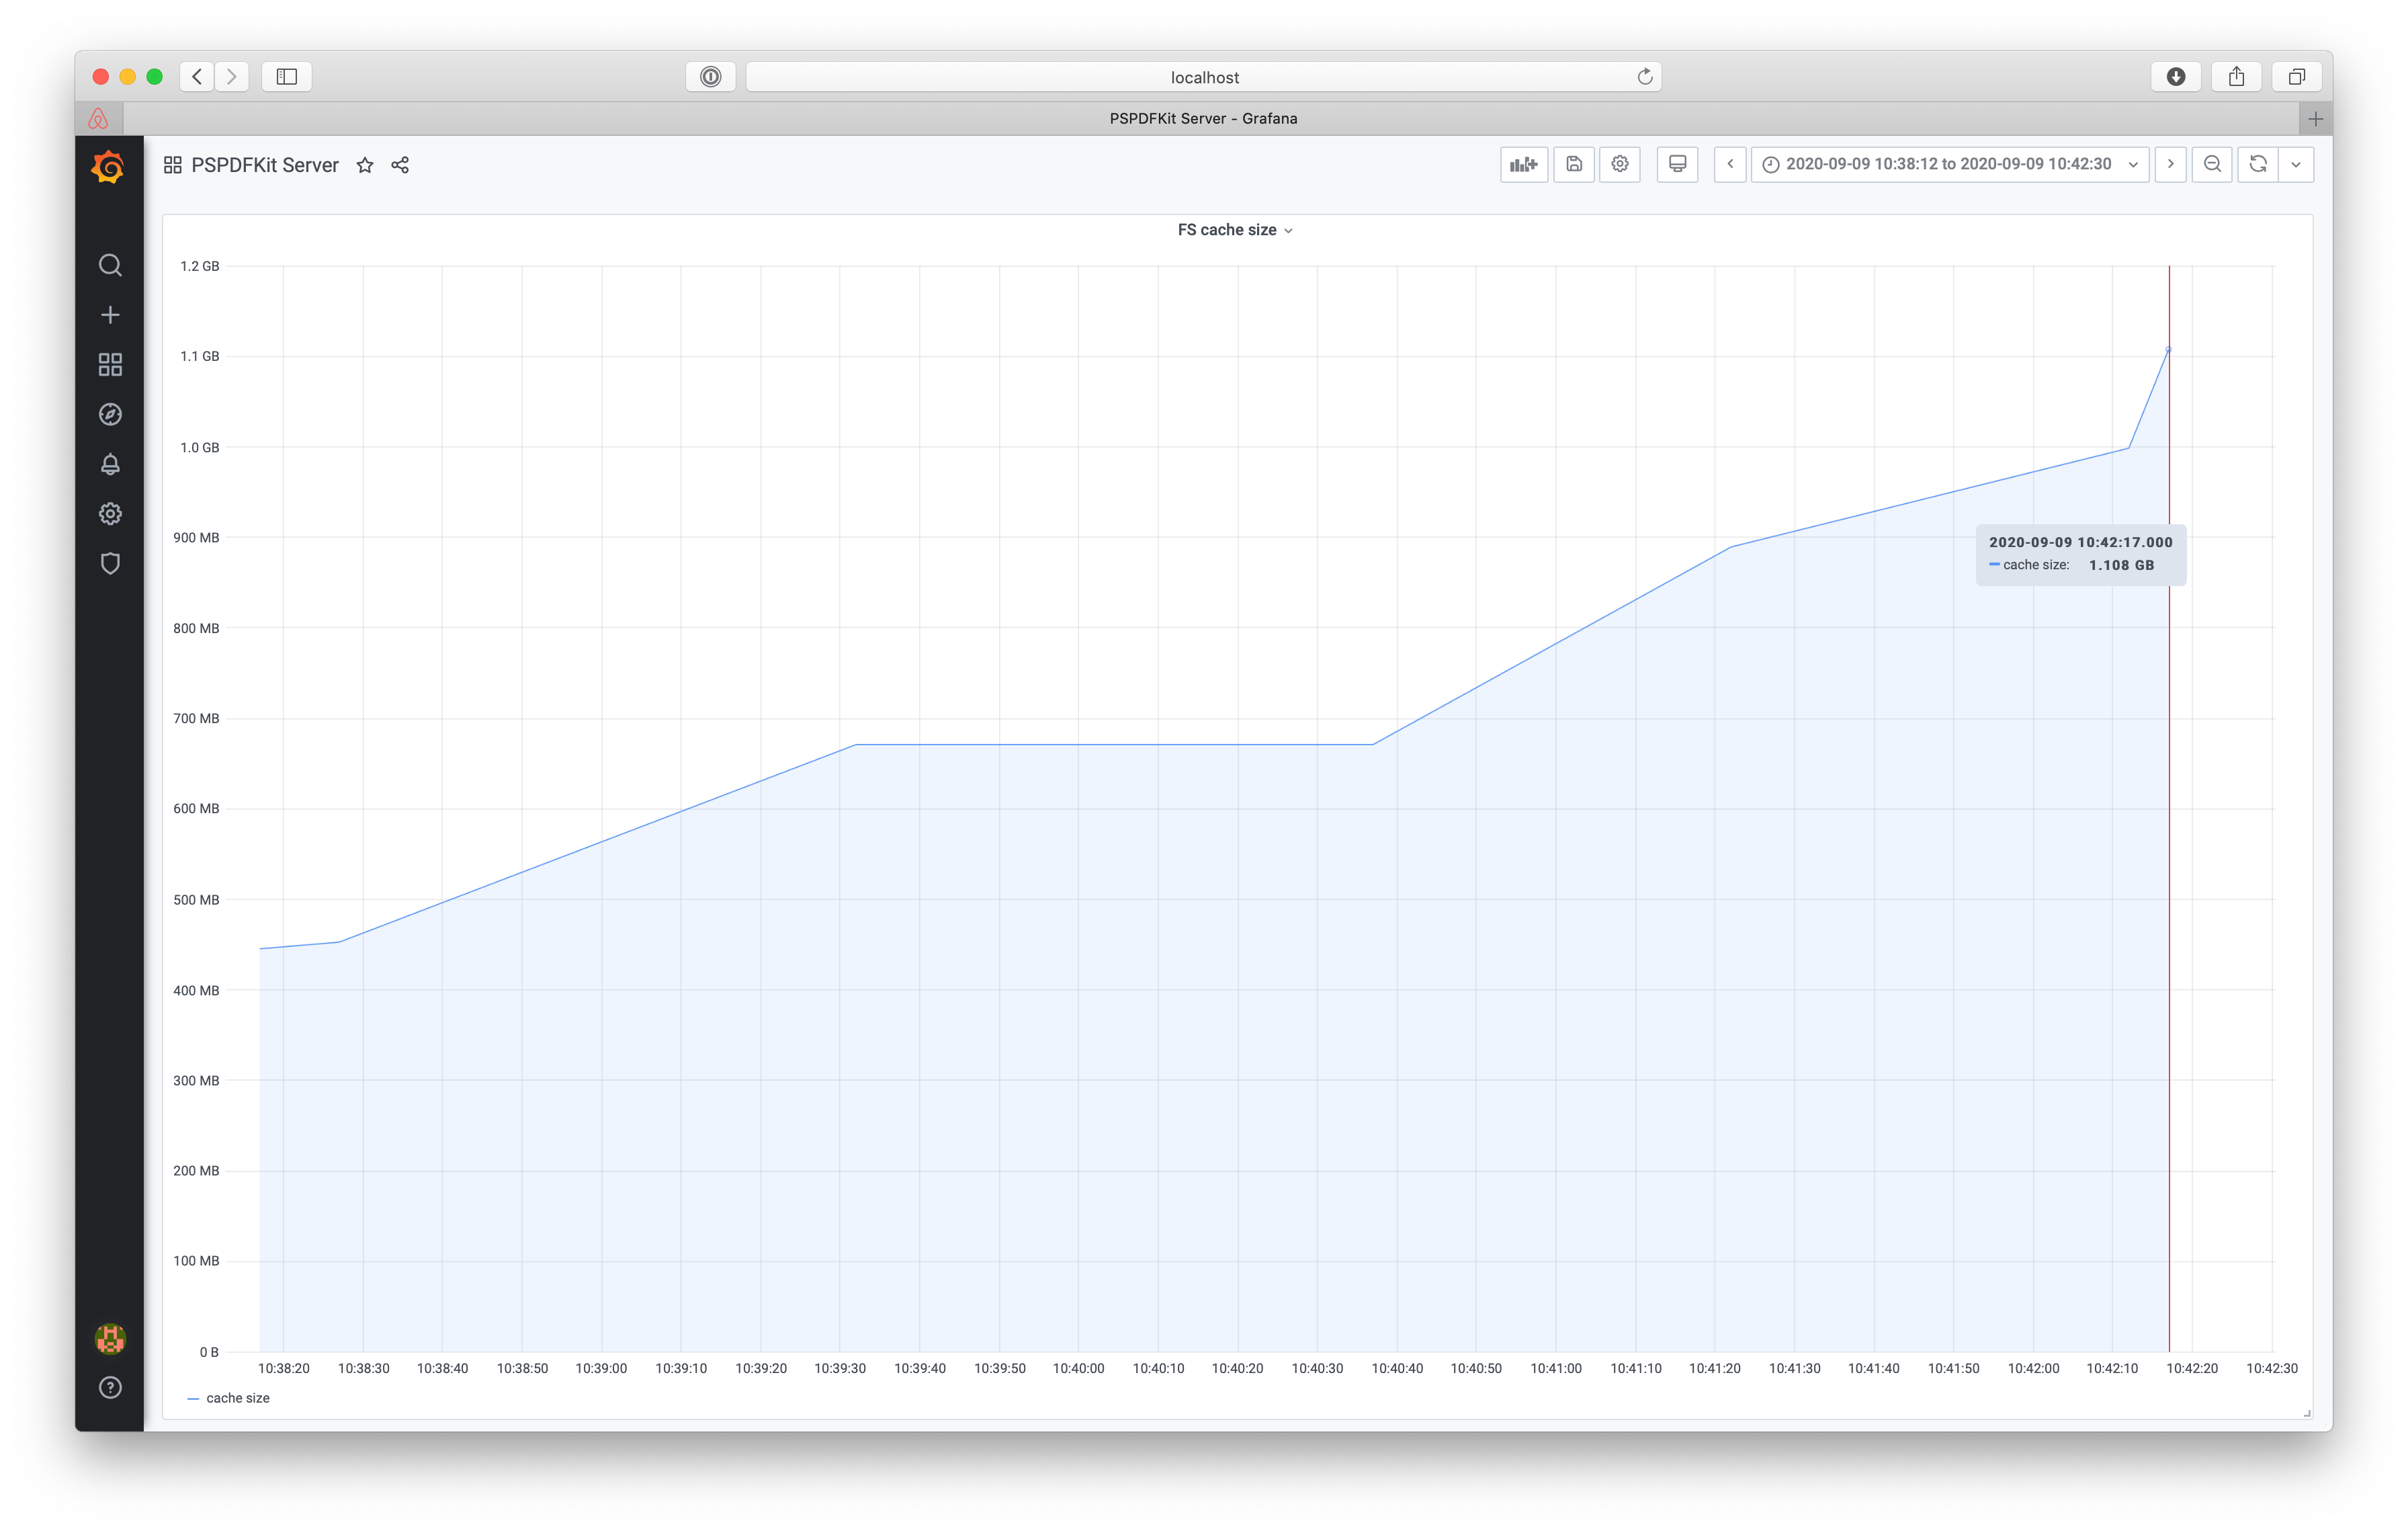
You can now track what the current cache size is, and you can determine if you should increase it. Depending on the document access patterns, this may or may not improve the perceived performance of rendering and PDF processing. However, the Server also exports cache hit and miss metrics so that you can see if increasing the cache yielded any improvements in that regard.
There’s More!
These are just two examples of the metrics we track. You can check out the whole list in our guides. You can also learn how to integrate metrics with your monitoring system on the integration page. And if you’re having trouble with Server performance, reach out to us and we’ll be happy to help.

