View usage details - In-tool or CSV export
The Diagnostics Tool is included with both Document Converter for SharePoint On-Premises and Nutrient Document Converter Services (DCS). You can access the Diagnostics Tool from the Start Menu by navigating to Nutrient Document Converter -> Diagnostics Tool.
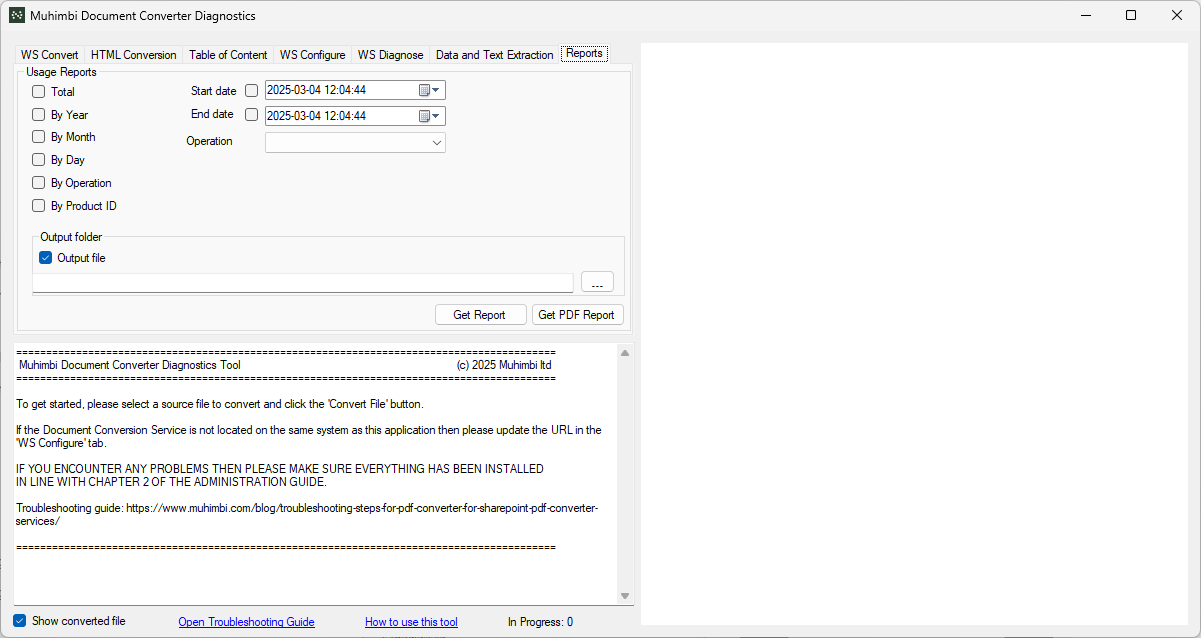
Starting with DCS version 12.2.0, the Diagnostics Tool includes a Reports tab to help you track how DCS is being used in your application or workflow.
You can view your usage reports within the tool from the Reports tab or export them as a CSV file. To export, check the Output File option and provide a valid file path.
To export your usage reports as a PDF file, refer to the View usage details - In-tool or PDF export guide.
Report options
The following options control how the Diagnostics Tool groups and filters usage data:
| Option | Description |
|---|---|
| Total | Group all usage data together |
| By Year | Group usage data by year |
| By Month | Group usage data by year and month |
| By Date | Group usage data by year, month, and day |
| By Operation | Group usage data by operation |
| By Product ID | Group usage data by product ID |
| Start Date | Return usage data for operations starting on or after the selected date |
| End Date | Return usage data for operations starting on or before the selected date |
| Operation | Return usage data only for the specified operation |
Output columns
The generated report includes the following columns:
| Column | Description |
|---|---|
| ContextID | Unique ID for each request to the web server |
| ProductID | Product ID that logged the usage |
| Operation | Operation number (based on operation type for DCS, job ID or step ID for Document Automation Server (DAS)) |
| Records | Number of records (a record may include one or more files) |
| Files | File count (usually input files, or output files for URL-based HTML conversion) |
| FilesSize | Total size of all files processed |
| Year | Year portion of the operation’s start time |
| MonthYear | Month and year portion of the start time |
| Date | Full date (year, month, day) of the start time |
| StartTime | Timestamp when the operation started |
| EndTime | Timestamp when the operation ended |
Example reports
The examples below are based on test data and do not reflect real usage.
Default report
| ContextID | ProductID | Operation | Files | FilesSize |
|---|---|---|---|---|
| c8394038-dfbf-428f-bd25-ff70b9d492dd | 4 | 0 | 1 | 373533 |
| 2eda6eae-3561-48c6-aba3-cfe42083e874 | 4 | 1 | 5 | 3327302 |
| 2eda6eae-3561-48c6-aba3-cfe42083e874 | 4 | 0 | 1 | 4565595 |
| 6767b877-97ba-416a-b940-aa0ce25d8390 | 4 | 1 | 6 | 287452 |
| 51b739a6-1d53-42d4-9688-494d2409fec4 | 4 | 3 | 1 | 373533 |
| af774bf2-bf5a-4fc7-8687-e3ffd616182d | 4 | 5 | 1 | 361179 |
| 0383116b-268a-4b6d-9d30-b8a70929adbe | 4 | 6 | 1 | 373533 |
| 84476fdb-f989-4447-9d6e-2bce53b96312 | 4 | 7 | 1 | 373533 |
| c5a49597-5e53-4c3e-bb3d-b0aa160df3ed | 4 | 8 | 1 | 21631 |
| a743d751-71d4-4171-b64f-0b9998640a63 | 4 | 9 | 1 | 21631 |
| ac8994f0-674f-45df-95d9-a99d78debfc2 | 4 | 10 | 1 | 21631 |
| b2c318f1-e905-42a5-9677-f21e47aa0fda | 4 | 11 | 1 | 21631 |
Report grouped by year
| Year | Records | Files | FilesSize |
|---|---|---|---|
| 2023 | 4987 | 8623 | 112153500 |
| 2024 | 5013 | 8327 | 111996000 |
| 2025 | 13 | 22 | 11117382 |
Report grouped by year and operation
| Year | Operation | Records | Files | FilesSize |
|---|---|---|---|---|
| 2023 | 0 | 357 | 357 | 8307000 |
| 2023 | 1 | 409 | 4045 | 9040500 |
| 2023 | 2 | 369 | 369 | 8257500 |
| 2023 | 3 | 379 | 379 | 8410500 |
| 2023 | 4 | 404 | 404 | 9198000 |
| 2023 | 5 | 370 | 370 | 8478000 |
| 2023 | 6 | 387 | 387 | 8500500 |
| 2023 | 7 | 379 | 379 | 8662500 |
| 2023 | 8 | 381 | 381 | 8550000 |
| 2023 | 9 | 400 | 400 | 8919000 |
| 2023 | 10 | 381 | 381 | 8361000 |
| 2023 | 11 | 366 | 366 | 8082000 |
| 2023 | 12 | 405 | 405 | 9387000 |
| 2024 | 0 | 396 | 396 | 8878500 |
| 2024 | 1 | 368 | 3682 | 8131500 |
| 2024 | 2 | 367 | 367 | 7924500 |
| 2024 | 3 | 376 | 376 | 8644500 |
| 2024 | 4 | 357 | 357 | 7749000 |
| 2024 | 5 | 403 | 403 | 9373500 |
| 2024 | 6 | 385 | 385 | 8802000 |
| 2024 | 7 | 378 | 378 | 8541000 |
| 2024 | 8 | 387 | 387 | 8289000 |
| 2024 | 9 | 379 | 379 | 8532000 |
| 2024 | 10 | 403 | 403 | 9067500 |
| 2024 | 11 | 402 | 402 | 8946000 |
| 2024 | 12 | 412 | 412 | 9117000 |
| 2025 | 0 | 2 | 2 | 4939128 |
| 2025 | 1 | 2 | 11 | 3614754 |
| 2025 | 3 | 1 | 1 | 373533 |
| 2025 | 5 | 1 | 1 | 361179 |
| 2025 | 6 | 1 | 1 | 373533 |
| 2025 | 7 | 1 | 1 | 373533 |
| 2025 | 8 | 1 | 1 | 21631 |
| 2025 | 9 | 1 | 1 | 21631 |
| 2025 | 10 | 1 | 1 | 21631 |
| 2025 | 11 | 1 | 1 | 21631 |
| 2025 | 13 | 1 | 1 | 995198 |