Efficiently run and analyze SharePoint jobs
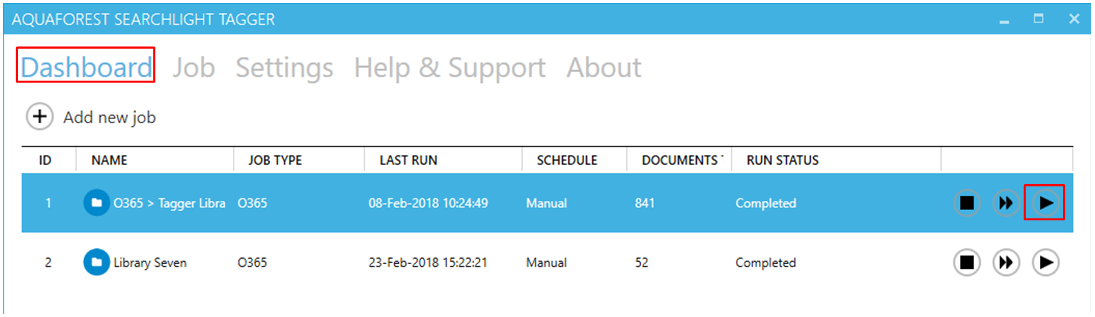
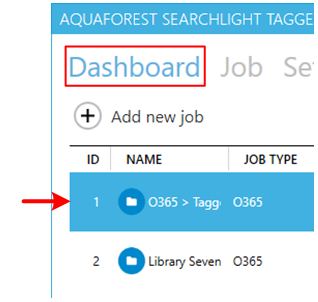
1. Select the job from the Dashboard
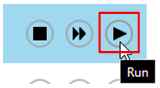
2. Click on the Run button.
NOTE: Make sure the service is running. Otherwise, you cannot run a job.
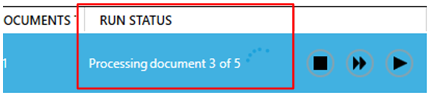
The Run Status column should change to “Processing x of y documents”
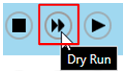
If you want to test the settings of the Job without actually updating any documents in SharePoint, you can choose the Dry Run button instead.
3. You can view the details of the documents already processed by going to Job > Status to view the LOG OUTPUT.
See section 4.10.1 for more details on the log output.
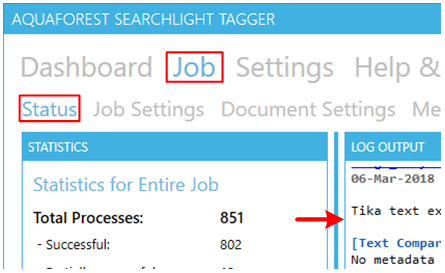
Log Output (Status)
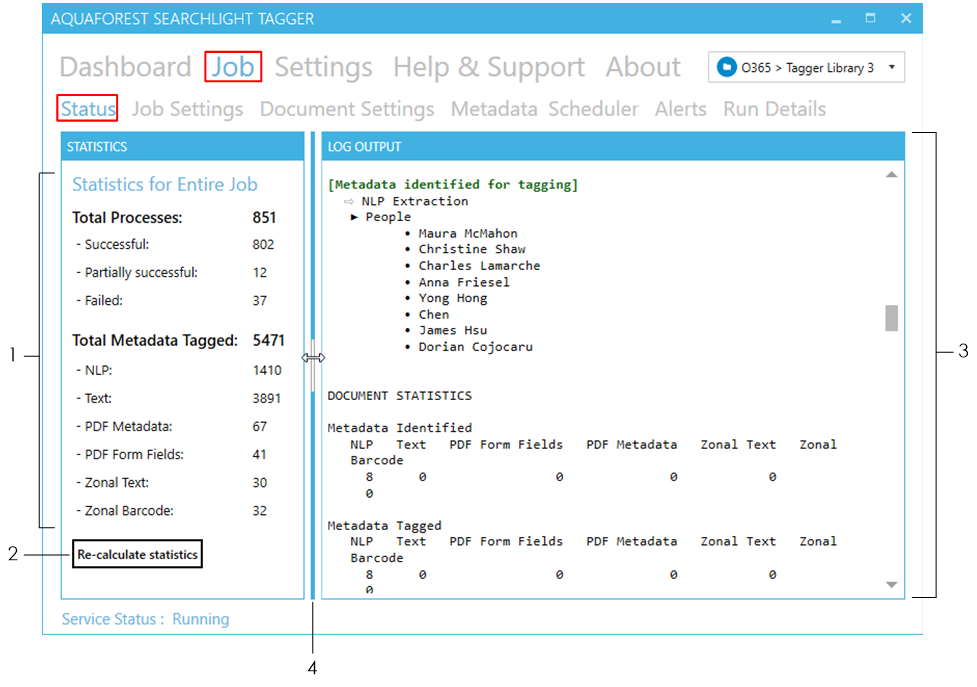
1. The Statistics panel shows a summary of all the documents processed so far (including previous Runs).
2. Sometimes, if there is an unexpected error or the computer restarts while a job is running, the statistics shown may not be accurate. Click on the Re-calculate statistics to refresh the values from the database.
![]()
3. This shows the full log file. It is updated live as the job runs. See section 4.10.1.1 about how to analyse the log output.
4 You can resize the STATISTICS and LOG OUTPUT panel.
![]()
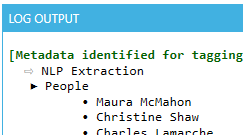
Analysing the log output
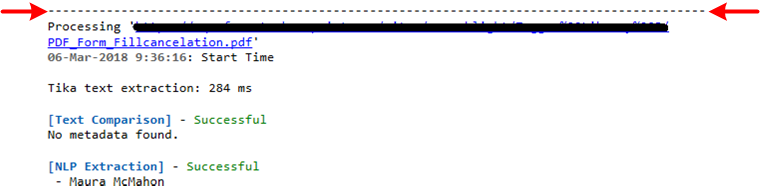
The log output for each processed document will be between dotted lines
Below is a list of outputs that (may) appear in the log output and what they mean.
| Ouput | Description |
|---|---|
| The date and time the processing started for this file. | |
| The time it took to extract and chunk the document’s text. | |
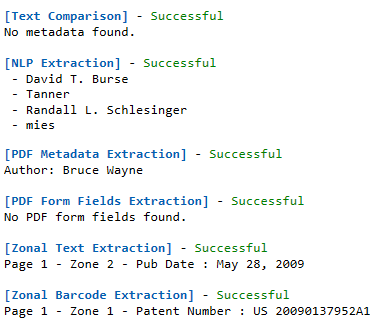 |
The extraction results for each extraction task specified (for the job) and whether they were successful or not. The result(s) of the extraction are shown under each task. If a task did not return any results, it will still mark it as successful. It is only when there is an error when attempting to extract metadata from the document that it will mark it as being unsuccessful. |
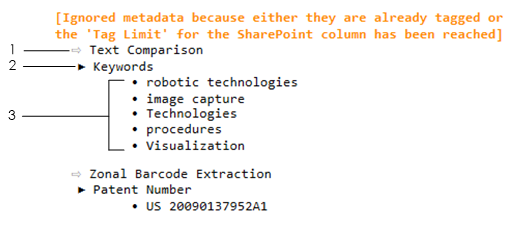 |
You will see in the log file if any metadata extracted from any of the tasks are already present in SharePoint for this document.- This shows the task that identified the metadata already in SharePoint- This is the SharePoint column that contain the metadata- This shows the list of metadata already in SharePoint.You will also receive this if the Tag Limit for a SharePoint column has been reached. See section 5.5 for more information on tag limits. |
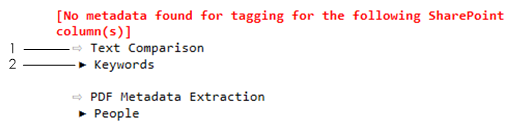 |
You will see this if no metadata is extracted for specific SharePoint columns after trying to extract using the defined task. This shows the task that could not extract any metadata. The SharePoint column for which no metadata was extracted. |
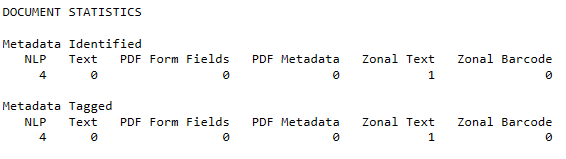 |
This is a summary of the number of metadata that was identified (extracted) by each task and how many of those identified metadata were actually tagged. If the number of metadata identified(extracted) is more than the number tagged, it could be because some of the metadata extracted were already tagged or the Tag for some of the SharePoint columns was reached |
For more detailed analysis of a job, go to Job > Run Details tab. See section 4.10.2 for more information.
Run Details
The Run Details tab enables detailed analysis of previous Job runs. To access it go to Job > Run Details.
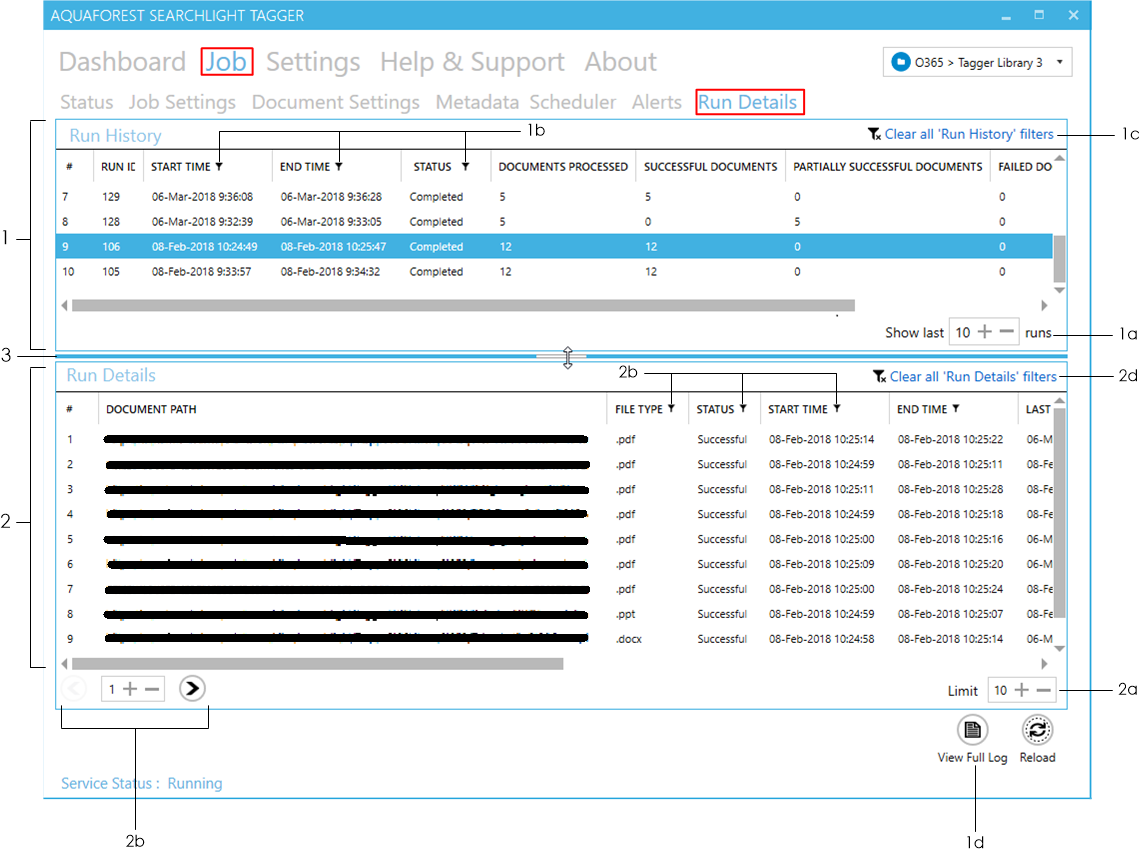
1 The Run History panel shows all the runs so far. 
a. You can choose how many runs to show. Runs are displayed in descending order of run date/time, that is, it will show the last ‘x’ runs. You need to click on the Reload button at the bottom of the window after updating this value.
b. You can filter the Run History by any column that has the ![]() icon next to it. You can apply multiple filters by filtering each column one by one.
c. Use this to clear all filters currently applied.
icon next to it. You can apply multiple filters by filtering each column one by one.
c. Use this to clear all filters currently applied.
![]()
d. Click this to view the log file of the selected run.

2. The Run Details panel shows all the documents that were processed for the selected run in the Run History panel.
a. You can limit the number of documents to display per page. You need to click on the Reload button at the bottom of the window after updating this value.
b.* Display the next/previous 10 documents (since Limit is set to 10).
![]()
c. You can filter the Run Details by any column that has the ![]() icon next to it. You can apply multiple filters by filtering each column one by one.
icon next to it. You can apply multiple filters by filtering each column one by one.
d. Use this to clear all filters currently applied ![]()
3. You can resize the Run History and Run Details panel
![]()