Enable Metrics Export

PSPDFKit Server has been deprecated and replaced by Document Engine. To migrate to Document Engine and unlock advanced document processing capabilities, refer to our migration guide. Learn more about these enhancements on our blog.
Similar to how it works with logs, Docker allows you to gather system-level metrics about running containers, like CPU usage, memory consumption, block device IO, etc. AWS, Google Cloud Platform, and Azure all offer solutions to collect these metrics from containers launched on their respective infrastructures.
See the following:
Since version 2020.5.0, Server provides the capability to send internal metrics to any metrics engine supporting the DogStatsD protocol, which is an extension of the popular StatsD protocol. Internal metrics offer more fine-grained insights into Server performance and help to pinpoint specific issues. Check out our metrics integration section below on how to enable internal Server metrics when running on-premises or in the cloud. The list of all exported metrics is available here.
Metrics Integration
PSPDFKit Server sends metrics using an open DogStatsD protocol, which is an extension of the popular StatsD protocol. Any metric collection engine that understands this protocol can ingest metrics exported by Server — including Telegraf, AWS CloudWatch Agent, and DogStatsD itself.
To enable exporting metrics, set the STATSD_HOST and STATSD_PORT configuration variables to point to the hostname and port where the collection engine is running.
You can also define custom metric tags by setting the STATSD_CUSTOM_TAGS environment variable to a comma-separated list of key-value pairs (with key and value separated by a =). For example, if you want to tag metrics with a region and a role, you can set the environment variable to region=eu,role=viewer.
This guide covers instructions on how to integrate Server metrics with various metric collection systems, more specifically:
Docker-Based Setup with Telegraf, InfluxDB, and Grafana
This deployment scenario integrates Server with Telegraf, InfluxDB, and Grafana via docker-compose. This approach is a great fit when you want to maintain complete control over the entire environment, you can’t deploy in the cloud, or you just want to try things out. It can be also adapted to other deployment orchestration tools based on Docker containers, such as Kubernetes.

In this setup, Server sends metrics to Telegraf, which aggregates time during fixed-period time buckets. After metrics are aggregated, they’re sent to InfluxDB for storage. Finally, the operator can view and analyze metrics in the Grafana dashboard by writing queries for InfluxDB.
Prerequisites
In order to complete this section, you’ll need to have Docker with docker-compose installed. You’ll also need a PSPDFKit Server activation key or a trial license key; refer to the Product Activation guide.
Setting Up
To get started, clone the repository with the configuration files: https://github.com/PSPDFKit/pspdfkit-server-example-metrics. In the root of the repository, you’ll find the following docker-compose.yml file:
version: "3.8"

services:
  grafana:
    image: grafana/grafana:7.1.5
    ports:
      - 3000:3000
    environment:
      - GF_SECURITY_ADMIN_PASSWORD=secret
    depends_on:
      - influxdb
    volumes:
      - ./grafana/provisioning/datasources:/etc/grafana/provisioning/datasources:ro
      - ./grafana/provisioning/dashboards:/etc/grafana/provisioning/dashboards:ro
      - ./grafana/dashboards:/var/lib/grafana/dashboards:ro
  influxdb:
    image: influxdb:1.8.2
  telegraf:
    image: telegraf:1.14.5-alpine
    depends_on:
      - influxdb
    volumes:
      - ./telegraf/telegraf.conf:/etc/telegraf/telegraf.conf:ro
  db:
    image: postgres:15
    environment:
      POSTGRES_USER: pspdfkit
      POSTGRES_PASSWORD: password
      POSTGRES_DB: pspdfkit
      PGDATA: /var/lib/postgresql/data/pgdata
    volumes:
      - pgdata:/var/lib/postgresql/data
  pspdfkit:
    image: pspdfkit/pspdfkit:2024.1.2
    environment:
      STATSD_HOST: telegraf
      STATSD_PORT: 8125

      ACTIVATION_KEY: <YOUR_ACTIVATION_KEY>
      DASHBOARD_USERNAME: dashboard
      DASHBOARD_PASSWORD: secret

      PGUSER: pspdfkit
      PGPASSWORD: password
      PGDATABASE: pspdfkit
      PGHOST: db
      PGPORT: 5432
      API_AUTH_TOKEN: secret
      SECRET_KEY_BASE: secret-key-base
      JWT_PUBLIC_KEY: |
        -----BEGIN PUBLIC KEY-----
        MIIBIjANBgkqhkiG9w0BAQEFAAOCAQ8AMIIBCgKCAQEA2gzhmJ9TDanEzWdP1WG+
        0Ecwbe7f3bv6e5UUpvcT5q68IQJKP47AQdBAnSlFVi4X9SaurbWoXdS6jpmPpk24
        QvitzLNFphHdwjFBelTAOa6taZrSusoFvrtK9x5xsW4zzt/bkpUraNx82Z8MwLwr
        t6HlY7dgO9+xBAabj4t1d2t+0HS8O/ed3CB6T2lj6S8AbLDSEFc9ScO6Uc1XJlSo
        rgyJJSPCpNhSq3AubEZ1wMS1iEtgAzTPRDsQv50qWIbn634HLWxTP/UH6YNJBwzt
        3O6q29kTtjXlMGXCvin37PyX4Jy1IiPFwJm45aWJGKSfVGMDojTJbuUtM+8P9Rrn
        AwIDAQAB
        -----END PUBLIC KEY-----
      JWT_ALGORITHM: RS256
    ports:
      - 5000:5000
    depends_on:
      - db
      - telegraf

volumes: pgdata:
This configuration file defines all services required to deploy Server and observe metrics reported by it. Remember to swap out the <YOUR_ACTIVATION_KEY> placeholder with the actual activation key of PSPDFKit Server. Note that Server is configured to send metrics to Telegraf: STATSD_HOST points to telegraf service, and STATSD_PORT is configured to use port 8125.
In the telegraf/ subdirectory, you’ll find the configuration for the Telegraf agent, telegraf.conf:
[agent]
  interval = "5s"

[[inputs.statsd]]
  service_address = ":8125"

  metric_separator = "."
  datadog_extensions = true

  templates = [
      "*.* measurement.field",
      "*.*.* measurement.measurement.field",
  ]

[[outputs.influxdb]]
  urls = ["http://influxdb:8086"]
  database = "pspdfkit"
Let’s go through the options defined here:
-
intervalspecifies how often Telegraf takes all the received data points and aggregates them into metrics. -
inputs.statsd.service_addressdefines the address of the UDP listener. The port number here must match theSTATSD_PORTconfiguration for Server. -
inputs.statsd.metric_separatorneeds to be set to.when used with PSPDFKit Server. -
inputs.statsd.datadog_extensionsneeds to be set totrueso that metric tags sent by Server are parsed correctly. -
inputs.statsd.templatesdefines how names of metrics sent by Server are mapped to Telegraf’s metric representation. This needs to be set to the exact value shown in the configuration file above. -
outputs.influxdbis the URL of the InfluxDB instance where data will be stored. -
outputs.influxdb.databaseis the name of the database in InfluxDB where metrics will be saved. You’ll need to use the same name when querying data in Grafana.
The above is just an example configuration file, and it’s by no means a complete configuration suitable for production deployments; refer to the Telegraf documentation for all the available options.
In the grafana/ subdirectory, you’ll find definitions of data sources, along with an example dashboard. You can provide all this data through Grafana UI; this is just an example to get you up and running quickly. Refer to the Grafana documentation for more information.
Now when you run docker-compose up from the directory when the docker-compose.yml file is placed, all the components will be started.
Viewing Metrics
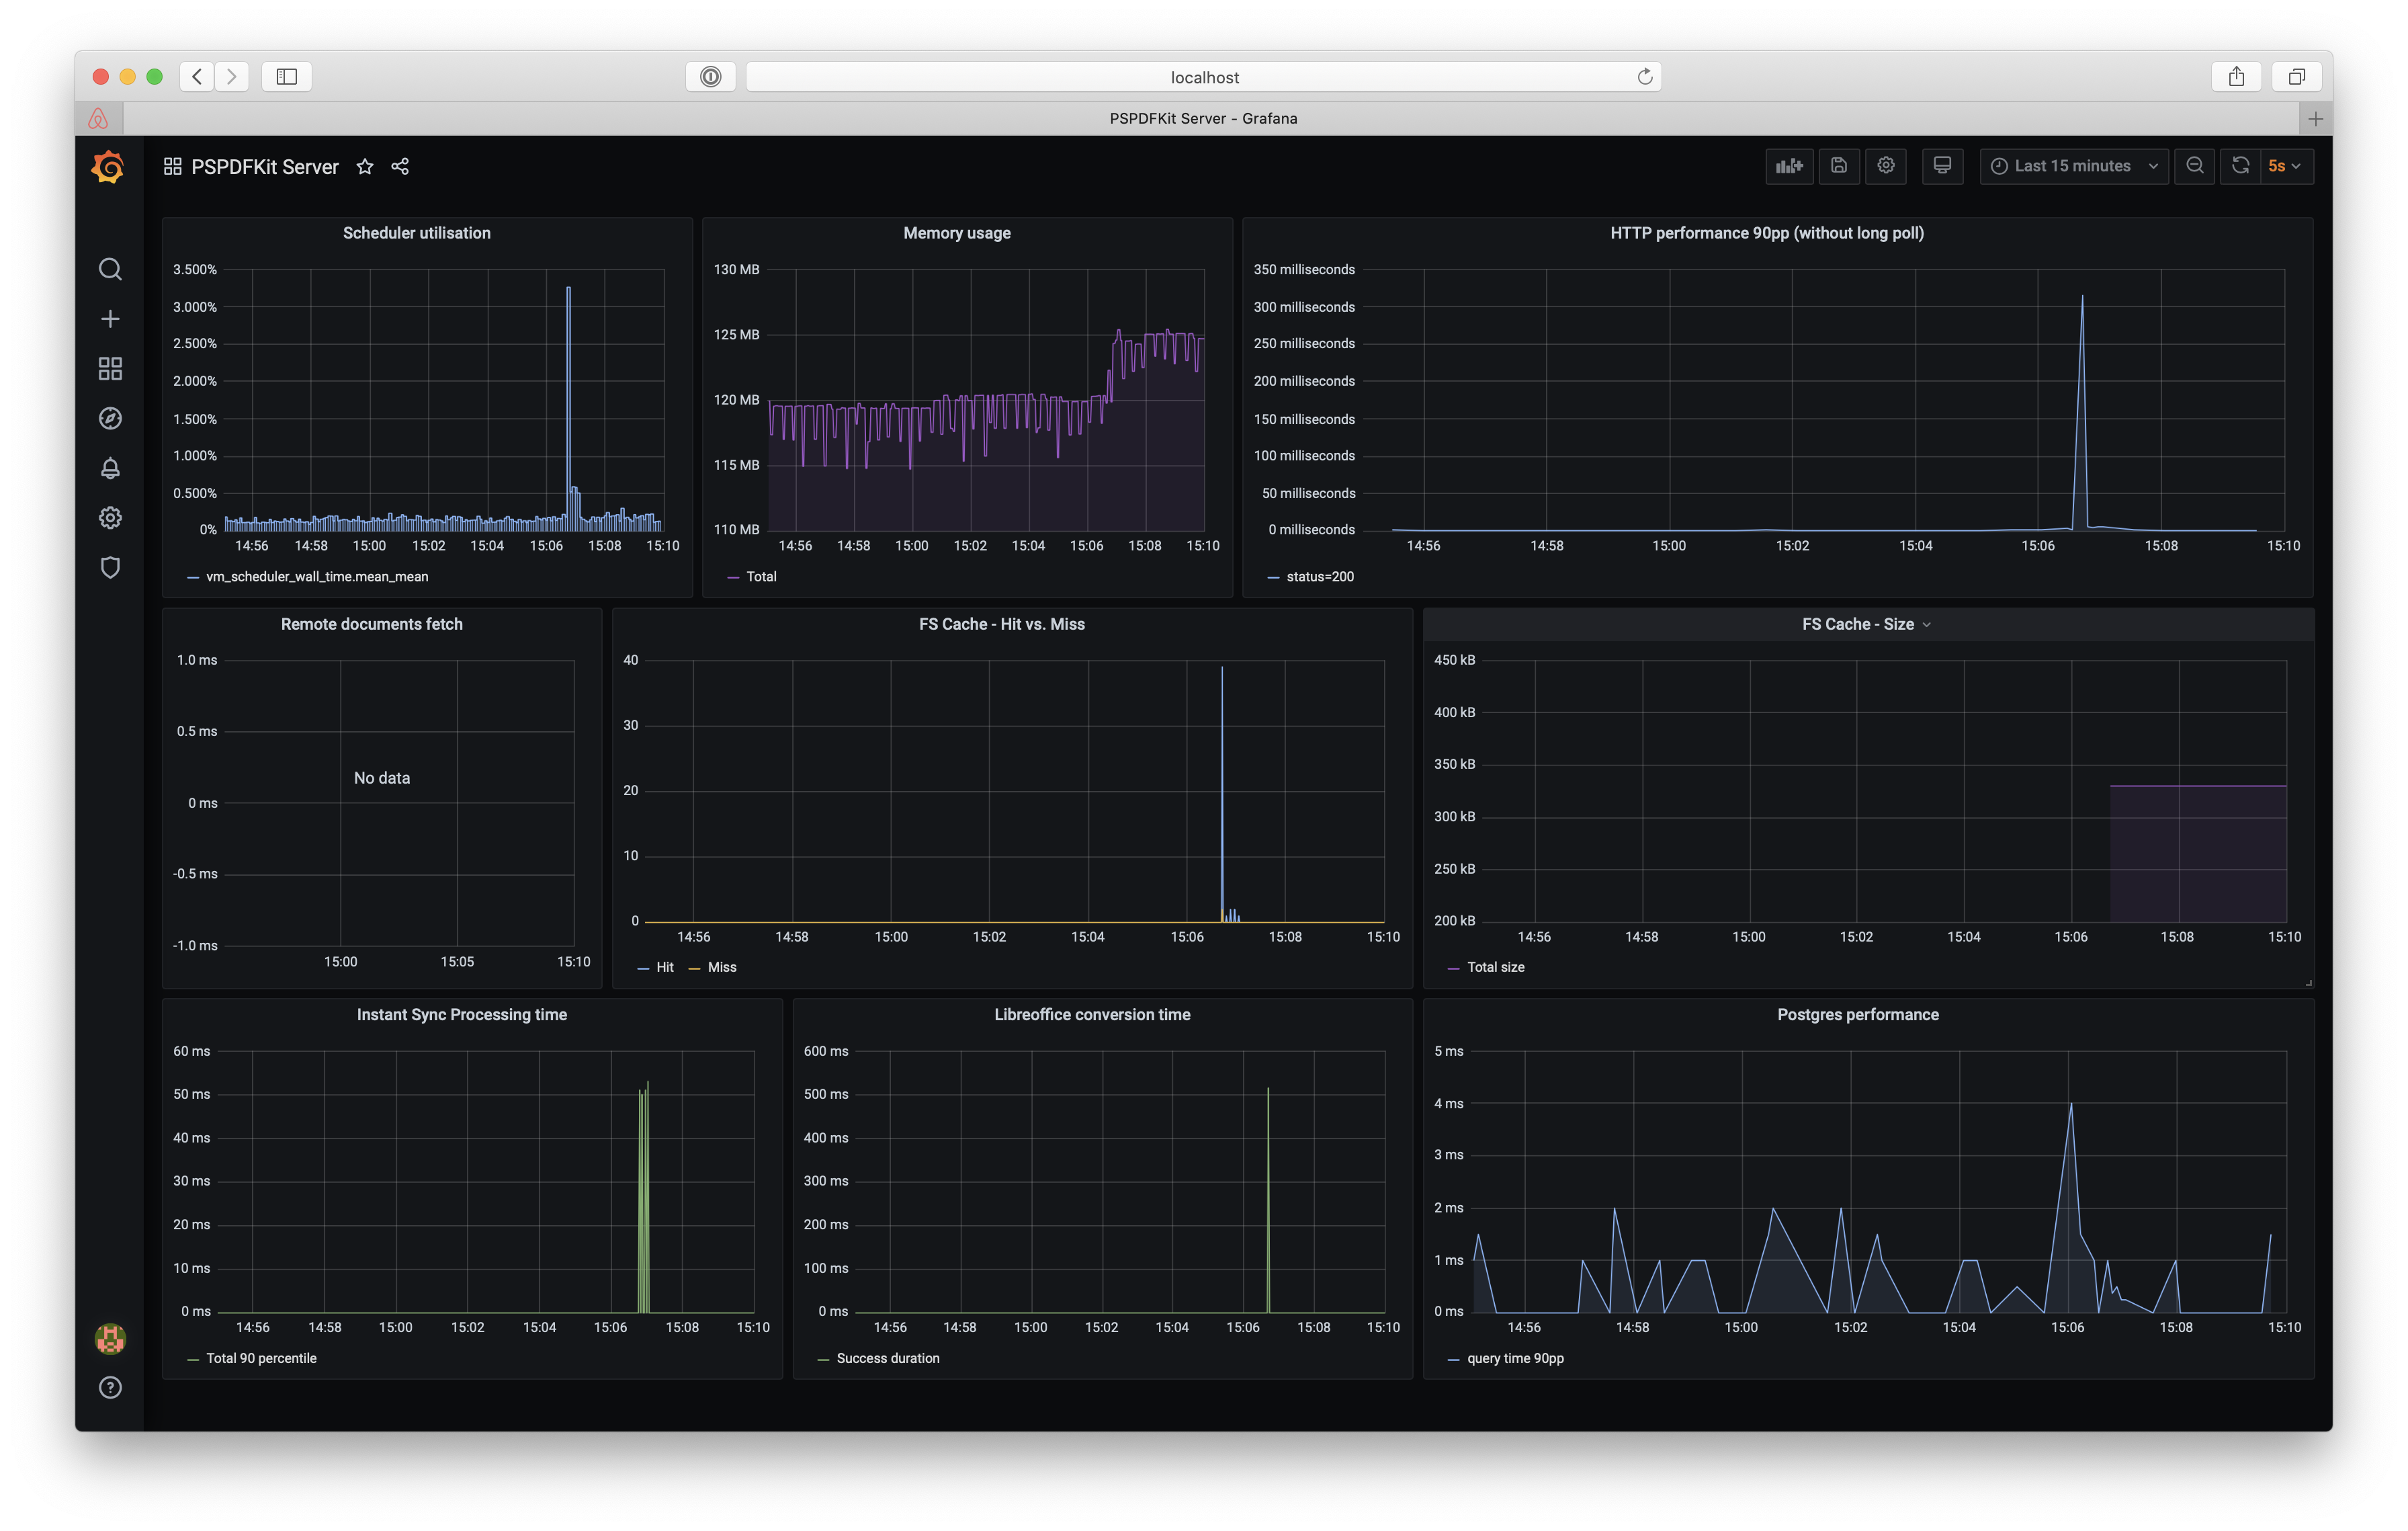
Head over to http://localhost:3000 in your browser to access the Grafana dashboard using admin/secret credentials to log in. Now open the PSPDFKit Server dashboard. You’ll see a dashboard like in the image below, but most likely with different data points.
ℹ️ Note: If no data is shown in the dashboard, open the Server dashboard at
<SERVER_URL>/dashboard, upload a couple documents, and perform some operations on them.
The dashboard shows a few crucial Server metrics — you can see their definitions by selecting a panel and choosing Edit. For a complete reference of available metrics, see this guide.
AWS CloudWatch
If you’re deploying your services to AWS, chances are you’re already monitoring them using AWS CloudWatch. If you followed our AWS deployment guide and host Server on AWS ECS, system-level metrics like CPU and memory utilization are automatically collected for you. This section shows how you can integrate PSPDFKit Server with the CloudWatch Agent to export internal Server metrics to CloudWatch.

Prerequisites
This section assumes you followed the Server AWS deployment guide or have deployed PSPDFKit Server to AWS ECS backed by an EC2 instance yourself.
Setting Up
First, you’ll need to install the CloudWatch agent on the host where it’s reachable by PSPDFKit Server. Refer to the CloudWatch agent installation guide for specific instructions.
The next step is agent configuration:
{
  "metrics": {
    "namespace": "PSPDFKitServer",
    "metrics_collected": {
      "statsd": {
        "service_address": ":8125"
      }
    }
  }
}
This configuration specifies that the agent should start a StatsD-compatible listener on port 8125. In addition, all metrics collected by the agent will be placed under the PSPDFKitServer namespace. Save the configuration in the cwagent.json file on the host where you installed the agent and run:
/opt/aws/amazon-cloudwatch-agent/bin/amazon-cloudwatch-agent-ctl -a fetch-config -c file:cwagent.json -s
ℹ️ Note: The command above requires root privileges.
You can see that the agent is up by running the following:
systemctl status amazon-cloudwatch-agent.service
The only thing that’s left is to configure PSPDFKit Server to send metrics to the agent. You’ll need the IP address or the DNS entry for the host — this depends on where you deployed the agent. Make sure Server can reach the agent on port 8125 (e.g. if you deployed it to AWS EC2, configure the security group to allow incoming UDP traffic on port 8125).
Now head to the ECS task definitions page and modify the task definition for PSPDFKit Server. Click on the most recent revision, select Create new revision, and scroll down to edit the Server container. Set the STATSD_HOST environment variable to point to the CloudWatch agent’s IP address or DNS entry, and set STATSD_PORT to point to 8125.

Save the changes and create a new revision. Now update the ECS service that’s running the PSPDFKit Server task and change the task definition revision to the one you just created. Then wait until the task restarts.
Viewing Metrics
You can now go to the AWS CloudWatch console to view the metrics exported by Server. (Note that it takes a while until the agent sends the collected metrics upstream). Use this link to go straight to the PSPDFKitServer namespace in the metrics browser: https://console.aws.amazon.com/cloudwatch/home#metricsV2:graph=~();namespace=~'PSPDFKitServer’.
As an example, to view the HTTP response time metric, search for http_server_req_end in the search box and tick all the checkboxes. You’ll see a graph of HTTP timing metrics grouped by the HTTP method and response status code.
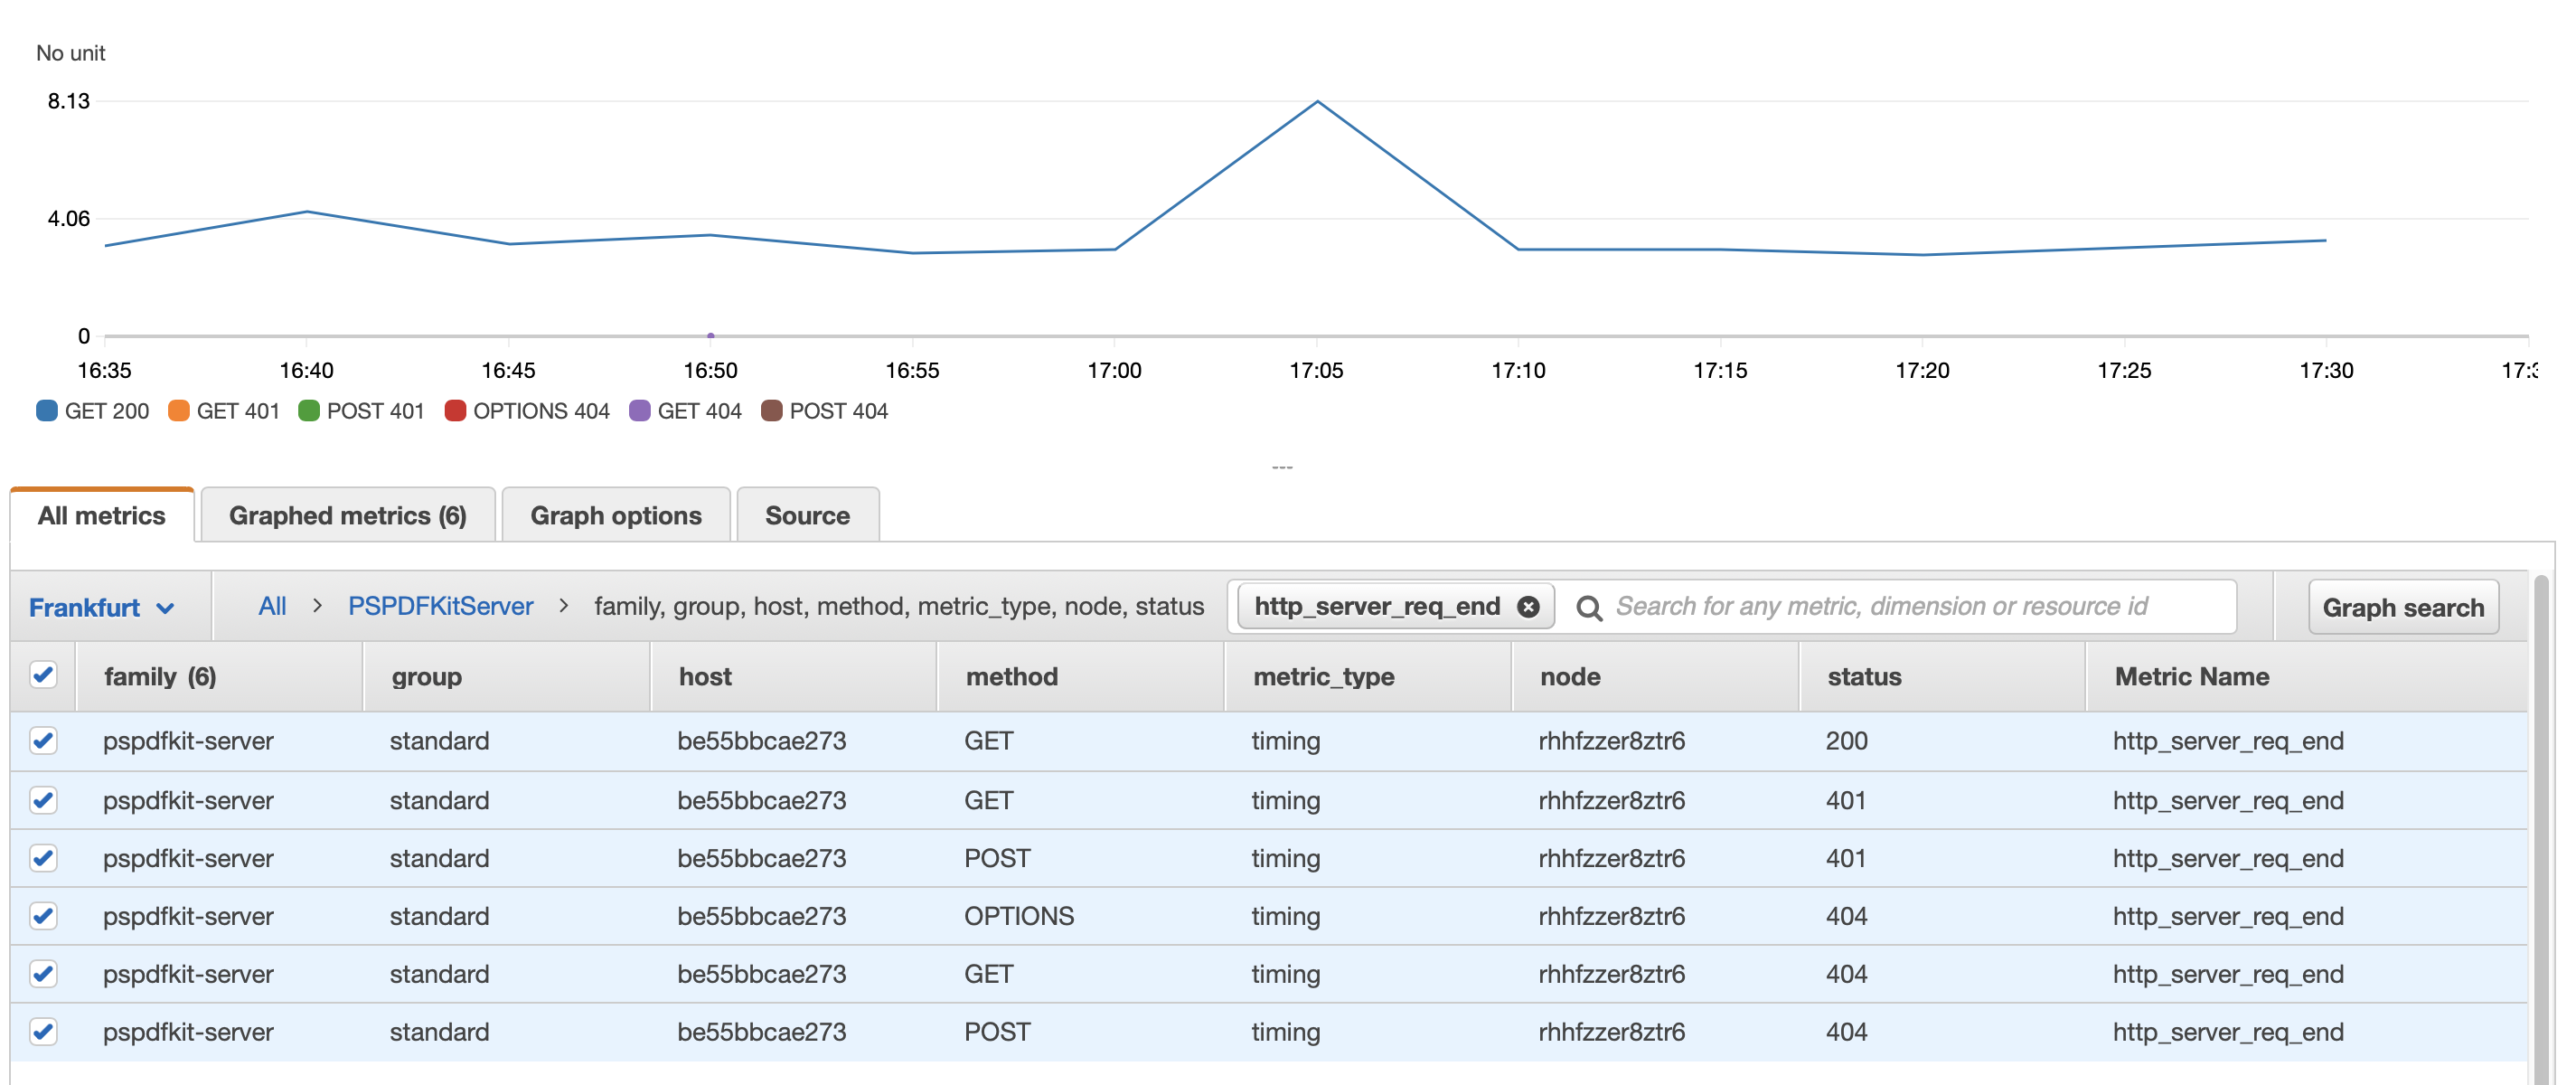
The data points you’ll see will most likely be different than what’s shown in the screenshot above.
ℹ️ Note: If there’s no data shown in the dashboard, open the Server dashboard at
<SERVER_URL>/dashboard, upload a couple documents, and perform some operations on them.
You can use the CloudWatch console to browse the available metrics. For more advanced use, see the CloudWatch search expressions and metric math guides. Check out the complete list of metrics exported by PSPDFKit Server on the metrics reference page.
Google Cloud Monitoring
Google Cloud Monitoring (formerly known as Stackdriver) is a monitoring service provided by the Google Cloud Platform. It’s a great choice when you deploy your services on the Google Kubernetes Engine (GKE) stack, since it provides metrics for all the Kubernetes resources out of the box. To forward metrics from PSPDFKit Server to Google Cloud Monitoring, you’ll use Telegraf.

Prerequisites
To follow this section, make sure you’ve deployed PSPDFKit Server to GKE as outlined in our deployment guide.
Setting Up
To get started, first you need to expose the Telegraf agent configuration as a ConfigMap in the GKE cluster. Save the following ConfigMap definition in the telegraf-config.yml file:
apiVersion: v1
kind: ConfigMap
metadata:
  name: telegraf-config
data:
  telegraf.conf: |
    [agent]
      interval = "90s"
      flush_interval = "90s"


    [[inputs.statsd]]
      service_address = ":8125"

      metric_separator = "."
      datadog_extensions = true

      templates = [
          "*.* measurement.field",
          "*.*.* measurement.measurement.field",
      ]

    [[outputs.stackdriver]]
      project = "<GCP PROJECT ID>"
      namespace = "pspdfkit"
This ConfigMap embeds the Telegraf configuration file directly. Let’s go through the options defined here:
-
intervalandflush_intervalspecify how often the metrics are aggregated and how often they’re pushed to Google Cloud. Make sureflush_intervalisn’t less than theinterval, and thatintervalis set to at least 60 seconds. This is because the Google Cloud Monitoring API allows you to create, at most, one data point per minute. -
inputs.statsd.service_addressdefines the address of the UDP listener. Use the port number defined here when creating a Service for the Telegraf agents. -
inputs.statsd.metric_separatorneeds to be set to.when used with PSPDFKit Server. -
inputs.statsd.datadog_extensionsneeds to be set totrueso that metric tags sent by Server are parsed correctly. -
inputs.statsd.templatesdefines how names of metrics sent by Server are mapped to Telegraf’s metric representation. This needs to be set to the exact value shown in the configuration file above. -
outputs.stackdriveris a configuration of the Google Cloud Monitoring output plugin. Make sure to put your actual GCP project name here.
The above is just an example configuration file, and it’s by no means a complete configuration suitable for production deployments; refer to the Telegraf documentation for all the available options.
You can create the ConfigMap in the cluster by running:
kubectl apply -f telegraf-config.yml
Now that the configuration is available, deploy Telegraf itself:
apiVersion: apps/v1
kind: DaemonSet
metadata:
  name: telegraf
spec:
  template:
    metadata:
      labels:
        app: telegraf
    spec:
      containers:
        - name: telegraf
          image: telegraf
          volumeMounts:
            - name: telegraf-config
              mountPath: /etc/telegraf/
              readOnly: true
      volumes:
        - name: telegraf-config
          configMap:
            name: telegraf-config
            items:
              - key: telegraf.conf
                path: telegraf.conf
---
apiVersion: v1
kind: Service
metadata:
  name: telegraf
spec:
  clusterIP: None
  selector:
    app: telegraf
  ports:
    - protocol: UDP
      port: 8125
      targetPort: 8125
This YAML file defines the Telegraf DaemonSet, which deploys a single Telegraf agent to every node in the GKE cluster, along with a headless Service that allows Server to reach Telegraf using a domain name. Notice that you’re mounting the previously defined Telegraf configuration as a file in the Telegraf container. Save that definition in telegraf.yml and run:
kubectl apply -f telegraf.yml
The last thing you need to do is configure PSPDFKit Server to send metrics to Telegraf. Modify the Server resource definition file by adding these two environment variables:
env:
  ...
  - name: STATSD_HOST
    value: telegraf
  - name: STATSD_PORT
    value: "8125"
Make sure to recreate the Server deployment by running kubectl apply -f on the file where it’s defined.
Viewing Metrics
To view metrics, head over to Monitoring in the Google Cloud console. If you follow that link, you’ll land on the Metrics Explorer page, where you can search for all the PSPDFKit Server metrics. Note that the PSPDFKit Server metrics are available under the Global resource.
For example, search for pspdfkit/http_server/req_end_mean to view the average HTTP response time of PSPDFKit Server. Apply a filter to only view metrics with a standard group, and group them by the HTTP method.
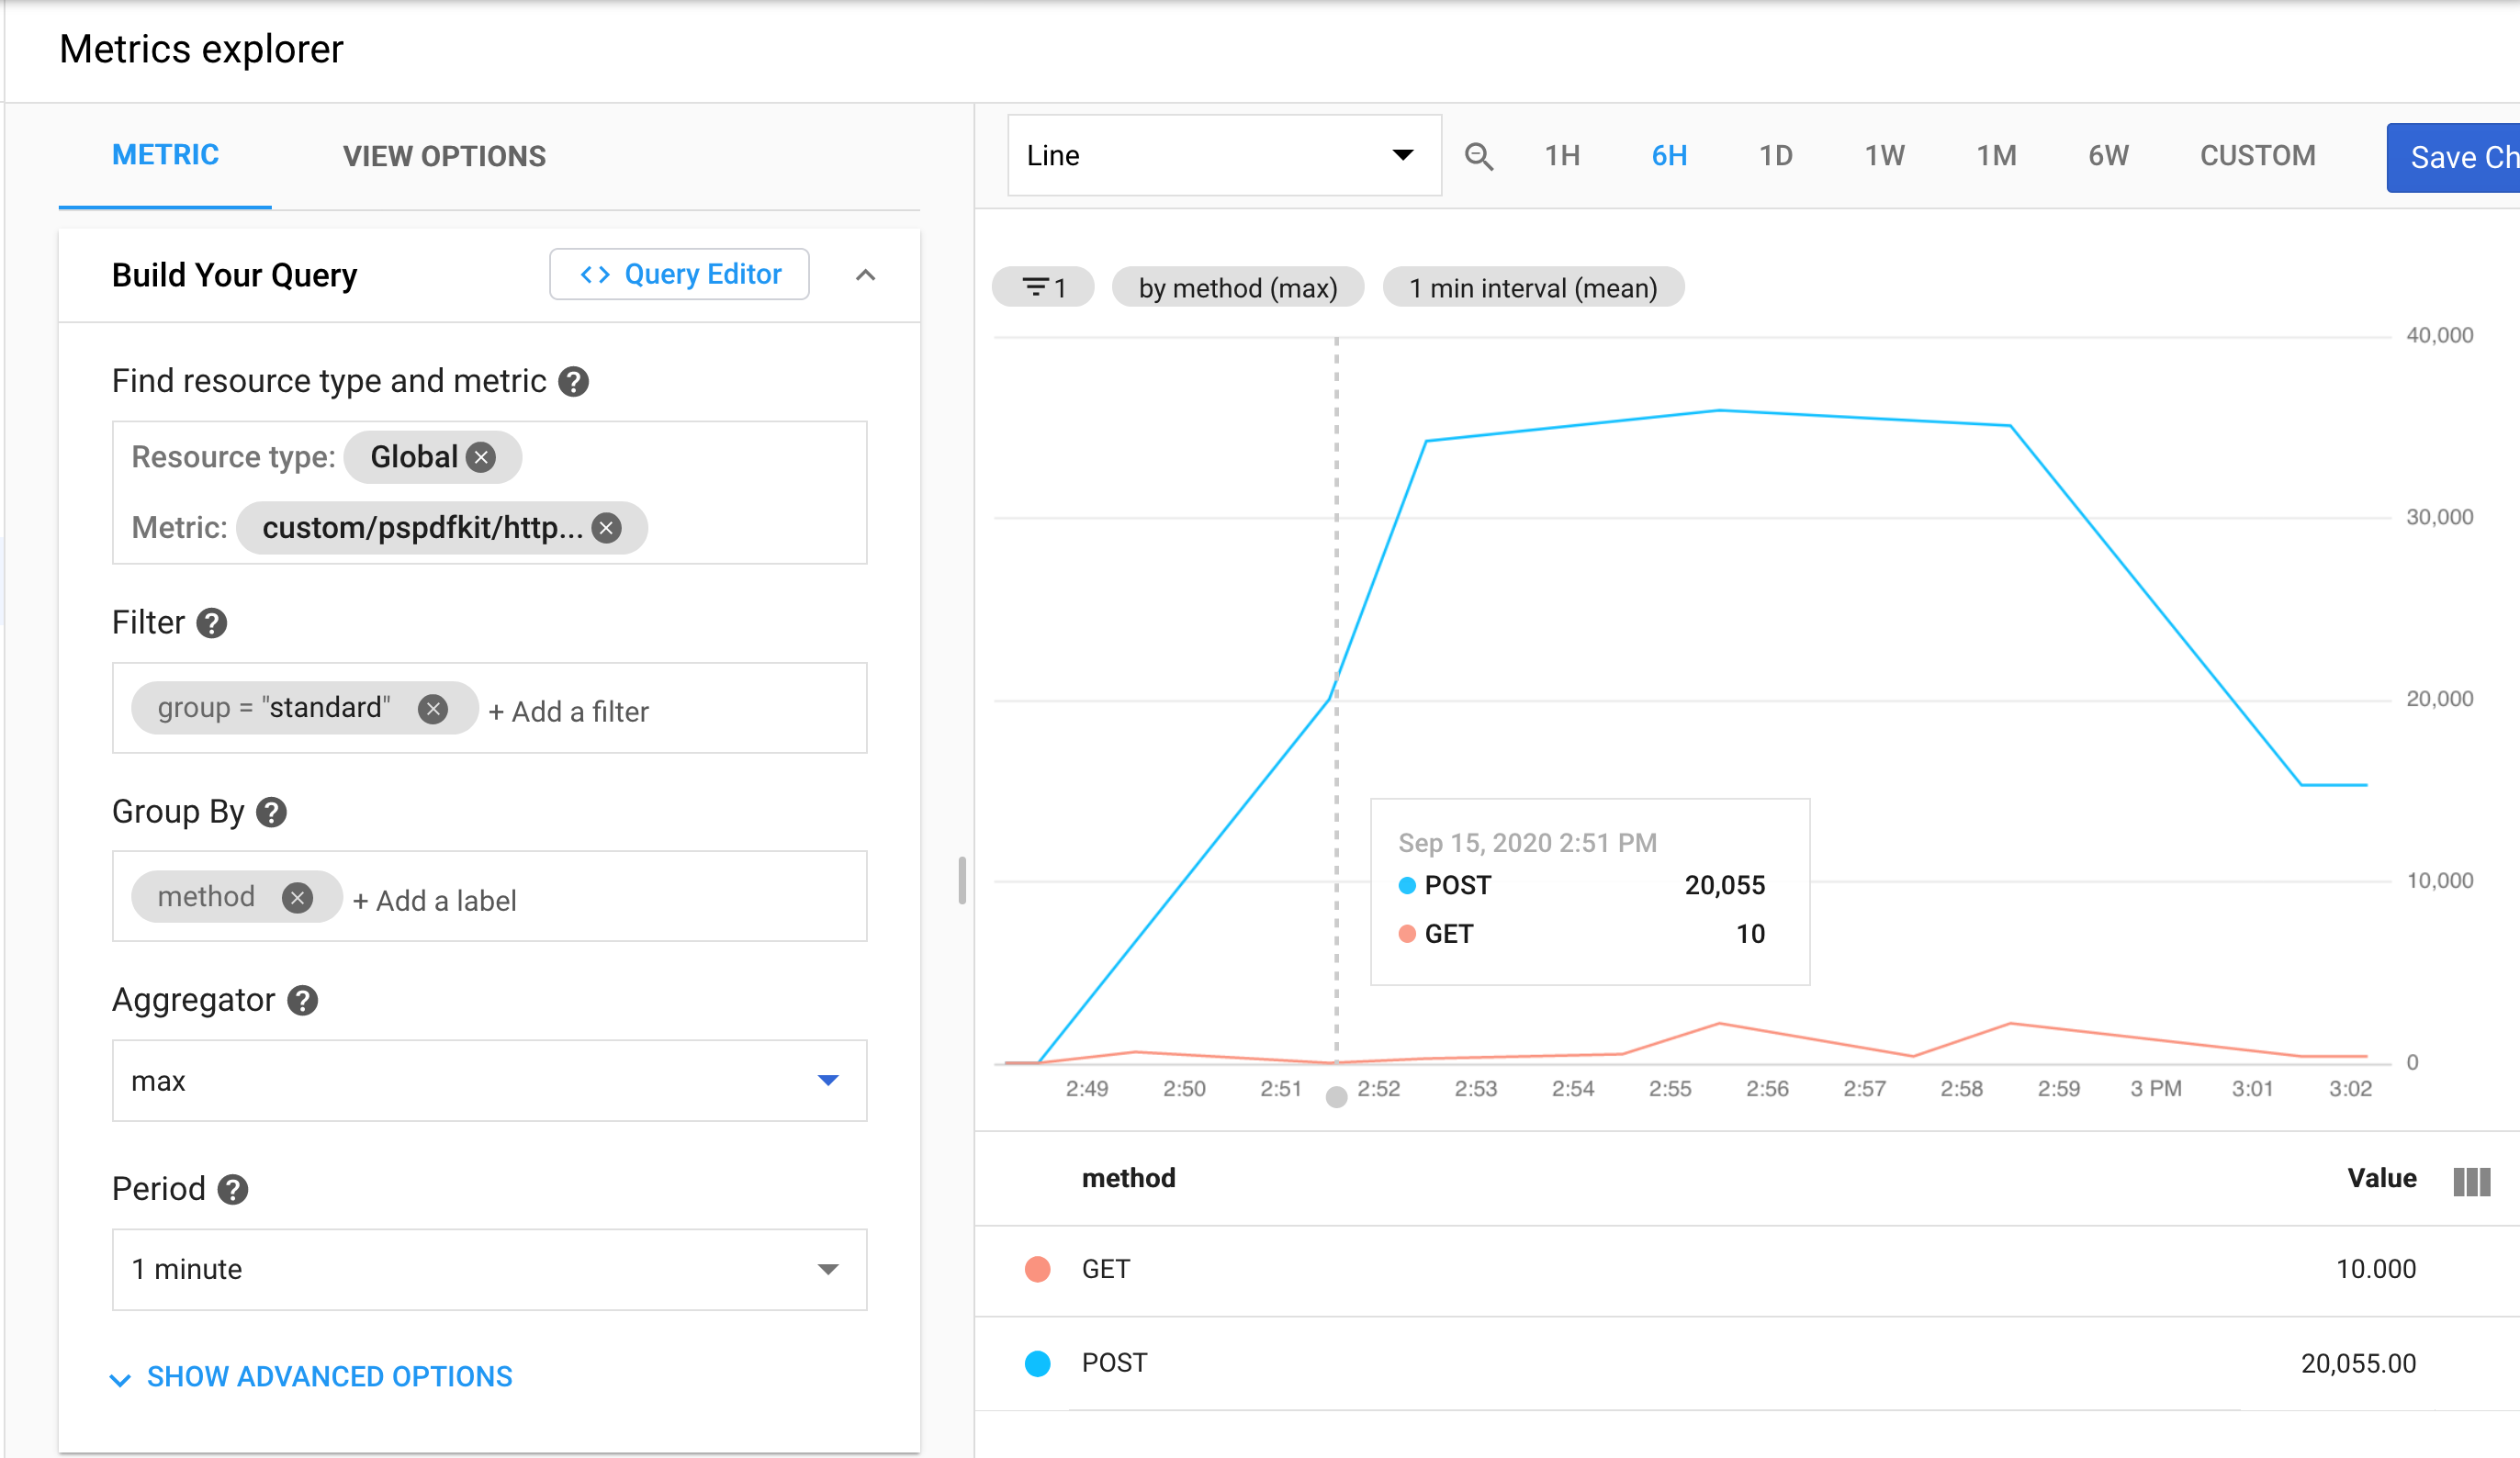
The data points you’ll see will most likely be different than what’s shown in the screenshot above.
ℹ️ Note: If there’s no data shown in the dashboard, open the Server dashboard at
<SERVER_URL>/dashboard, upload a couple documents, and perform some operations on them.
You can now add the chart to the dashboard, or continue exploring available metrics. Learn more about how to build an advanced monitoring solution on top of Google Cloud Monitoring by following the relevant guides.
Azure Monitor
If you’re already using tools from the Microsoft ecosystem and deploying your software to Azure, you should consider sending metrics to Azure Monitor. As with other metrics aggregation services available natively on cloud platforms, it provides a wide range of metrics for resources on the platform, and it can also be used to store and visualize custom metrics from any application, including PSPDFKit Server. You’ll use Telegraf to export metrics from PSPDFKit Server to Azure Monitor.

Prerequisites
In order to follow this section, make sure you’ve deployed PSPDFKit Server to AKS.
Setting Up
Sending metrics to Azure Monitor requires authentication — any service that wants to publish metrics needs to have specific permissions. The easiest way to do this is to assign a built-in Monitoring Metrics Publisher role to the managed identity sending metrics. However, at the moment of writing, Azure doesn’t provide a native way to assign managed identities to Kubernetes Pods running on AKS. In order to assign required permissions to pods running Telegraf agent, you’ll deploy the AAD Pod Identity operator (an open source project built by the Azure team) to bind managed identities to relevant pods.
Deploying the AAD Pod Identity Operator
As a first step, you must grant the service principal or managed identity that runs your AKS cluster nodes permission to assign identities to those nodes. Follow this document to find out if you’re running AKS nodes with service principal or managed identity, and if so, to learn how to obtain the service principal or managed identity client ID.
After you get the ID, make sure to save it in the CLUSTER_IDENTITY_CLIENT_ID environment variable.
Now, run the following commands:
SUBSCRIPTION_ID=$(az account show --query id -o tsv)
CLUSTER_RESOURCE_GROUP_NAME=$(az aks show --resource-group pspdfkitresourcegroup --name pspdfkitAKScluster --query nodeResourceGroup -otsv)
CLUSTER_RESOURCE_GROUP="/subscriptions/${SUBSCRIPTION_ID}/resourcegroups/${CLUSTER_RESOURCE_GROUP_NAME}"
# Assign permission to modify properties of the node VMs in the cluster.
az role assignment create --role "Virtual Machine Contributor" --assignee ${CLUSTER_IDENTITY_CLIENT_ID} --scope ${CLUSTER_RESOURCE_GROUP}
# Assign permission to assign identities created in the cluster resource group.
az role assignment create --role "Managed Identity Operator" --assignee ${CLUSTER_IDENTITY_CLIENT_ID} --scope  ${CLUSTER_RESOURCE_GROUP}
ℹ️ Note: If you get an error that says you have insufficient permissions, contact your Azure Active Directory (Azure AD) administrator.
After the permissions have been assigned, you can deploy the operator. Run the following in the shell:
kubectl apply -f https://raw.githubusercontent.com/Azure/aad-pod-identity/master/deploy/infra/deployment-rbac.yaml
kubectl apply -f https://raw.githubusercontent.com/Azure/aad-pod-identity/master/deploy/infra/mic-exception.yaml
When you run kubectl get deployments.apps, you should see mic deployment up and running:
NAME       READY   UP-TO-DATE   AVAILABLE   AGE
mic        1/1     1            1           3h56m
pspdfkit   1/1     1            1           93m
Creating Identity with Permissions to Publish Metrics
Now you’re going to create an identity with permissions to write metrics to Azure Monitor. You’ll later assign this to the pod running Telegraf agent.
First, create a new identity:
az identity create --name telegraf --resource-group ${CLUSTER_RESOURCE_GROUP}
TELEGRAF_IDENTITY_ID=$(az identity show --resource-group ${CLUSTER_RESOURCE_GROUP} --name telegraf --query id -otsv)
TELEGRAF_IDENTITY_CLIENT_ID=$(az identity show --resource-group ${CLUSTER_RESOURCE_GROUP} --name telegraf --query clientId -otsv)
Then assign it a Monitoring Metrics Publisher role:
CLUSTER_ID=$(az aks show --resource-group pspdfkitresourcegroup --name pspdfkitAKScluster --query id -otsv)
az role assignment create --role 'Monitoring Metrics Publisher' --assignee $TELEGRAF_IDENTITY_ID --scope ${CLUSTER_ID}
Note that the identity only has permission to write metrics in the scope of the AKS cluster.
Now that the identity is created, you need to let the AAD Pod Identity operator know that you want to assign that identity to specific nodes in the cluster. You can do this by creating AzureIdentity and AzureIdentityBinding custom resources:
apiVersion: aadpodidentity.k8s.io/v1
kind: AzureIdentity
metadata:
  name: telegraf
spec:
  type: 0
  resourceID: <TELEGRAF_IDENTITY_ID>
  clientID: <TELEGRAF_IDENTITY_CLIENT_ID>
---
apiVersion: aadpodidentity.k8s.io/v1
kind: AzureIdentityBinding
metadata:
  name: telegraf-binding
spec:
  azureIdentity: telegraf
  selector: telegraf
Copy the YAML definition above, and replace <TELEGRAF_IDENTITY_ID> and <TELEGRAF_IDENTITY_CLIENT_ID> with the values of $TELEGRAF_IDENTITY_ID and $TELEGRAF_IDENTITY_CLIENT_ID environment variables, respectively. This definition means that the telegraf identity you created (azureIdentity: telegraf) should be assigned to any pod whose aadpodidbinding label matches the value of telegraf (selector: telegraf).
Create the resource in the cluster by running kubectl apply -f telegraf-identity.yml.
Configuring Telegraf
Since the identity for Telegraf is ready, you can prepare its configuration. You’ll provision the configuration file in Kubernetes’ ConfigMap:
apiVersion: v1
kind: ConfigMap
metadata:
  name: telegraf-config
data:
  telegraf.conf: |
    [agent]
      interval = "60s"
      flush_interval = "60s"

    [[inputs.statsd]]
      service_address = ":8125"

      percentiles = [90]

      metric_separator = "."
      datadog_extensions = true

      templates = [
          "*.* measurement.field",
          "*.*.* measurement.measurement.field",
      ]

    [[outputs.azure_monitor]]
      namespace_prefix = "pspdfkit/"
      resource_id = <CLUSTER_ID>
Replace the <CLUSTER_ID> placeholder with the value of the $CLUSTER_ID environment variable and save the configuration in the telegraf-config.yml file.
Let’s quickly discuss the configuration options:
-
intervalandflush_intervalspecify how often the metrics are collected and how often they’re written to Azure Monitor. Make sureflush_intervalisn’t less than theinterval. -
inputs.statsd.service_addressdefines the address of the UDP listener. Use the port number defined here when creating a Service for the Telegraf agents. -
inputs.statsd.metric_separatorneeds to be set to.when used with PSPDFKit Server. -
inputs.statsd.datadog_extensionsneeds to be set totrueso that metric tags sent by Server are parsed correctly. -
inputs.statsd.templatesdefines how names of metrics sent by Server are mapped to Telegraf’s metric representation. This needs to be set to the exact value shown in the configuration file above. -
outputs.azure_monitoris a configuration for the Azure Monitor exporter. Theresource_idis the cluster ID you used when granting metric publishing privileges to the Telegraf identity.
The above is just an example configuration file, and it’s by no means a complete configuration suitable for production deployments; refer to the Telegraf documentation for all the available options.
Create the ConfigMap in the cluster by running:
kubectl apply -f telegraf-config.yml
Deploying Telegraf and Configuring PSPDFKit Server
You can now deploy Telegraf to the cluster, instructing it to use the provisioned configuration. The following file defines a DaemonSet and a headless Service for the Telegraf agents:
apiVersion: apps/v1
kind: DaemonSet
metadata:
  name: telegraf
spec:
  selector:
    matchLabels:
      app: telegraf
  template:
    metadata:
      labels:
        app: telegraf
        aadpodidbinding: telegraf
    spec:
      containers:
        - name: telegraf
          image: telegraf
          volumeMounts:
            - name: telegraf-config
              mountPath: /etc/telegraf/
              readOnly: true
      volumes:
        - name: telegraf-config
          configMap:
            name: telegraf-config
            items:
              - key: telegraf.conf
                path: telegraf.conf
---
apiVersion: v1
kind: Service
metadata:
  name: telegraf
spec:
  clusterIP: None
  selector:
    app: telegraf
  ports:
    - protocol: UDP
      port: 8125
      targetPort: 8125
The DaemonSet will make sure there’s a single Telegraf agent available on each node in the cluster, and the headless service allows communication with the agent using a domain name. Notice that aadpodidbinding is set to telegraf, so that the identity binding you created before gets applied and the Telegraf agent will be granted permission to write metrics to Azure Monitor. Save the specification above in the telegraf.yml file and run kubectl apply -f telegraf.yml to trigger deployment.
Finally, the last part is to configure PSPDFKit Server to start sending metrics to the Telegraf agent. Edit the Server deployment file and add these two environment variables:
env:
  ...
  - name: STATSD_HOST
    value: telegraf
  - name: STATSD_PORT
    value: "8125"
Update the Server deployment by running kubectl apply -f on the deployment definition file.
Viewing Metrics
In order to view metrics, go to Azure Monitor service in Azure portal and navigate to Metrics in the sidebar. You’ll be prompted to select a monitored resource — since you used the AKS cluster as the resource for which the metrics are written, you need to find the cluster by typing its name in the search field, select the checkbox, and click Apply.
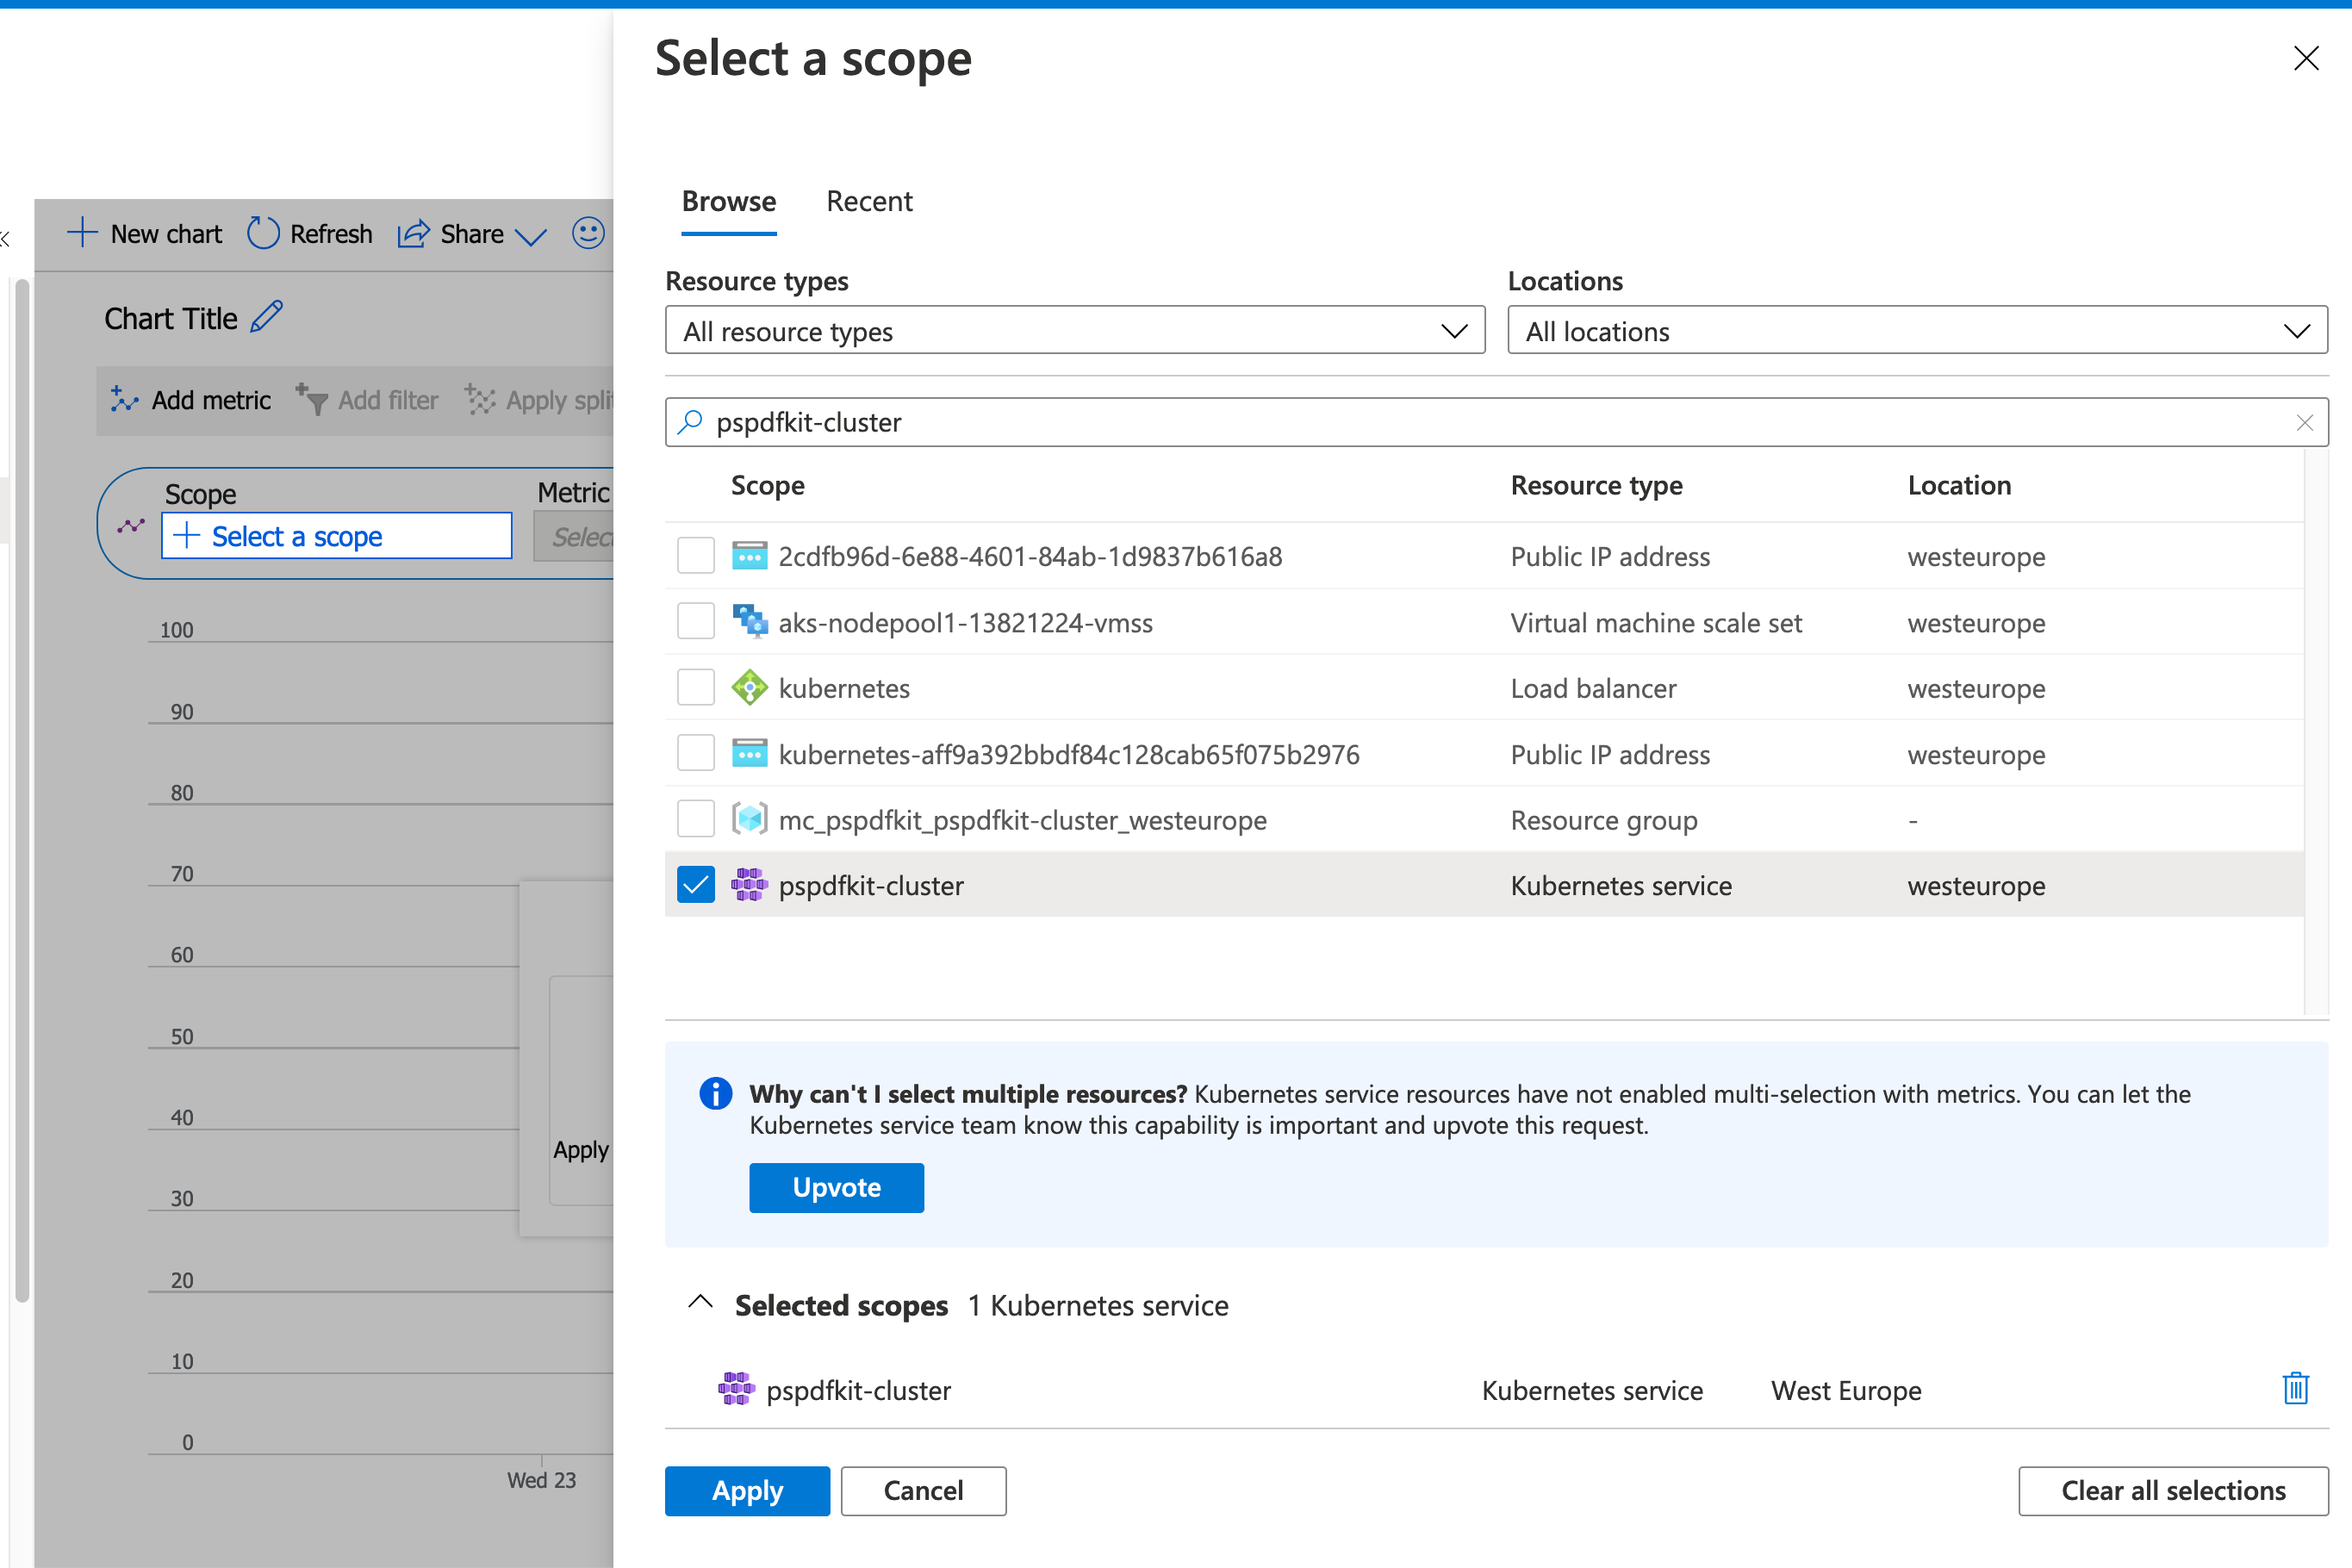
In the Metric Namespace selection box, find pspdfkit/http_server and choose req_end_90_percentile for the metrics. Pick Max as the aggregation. Now click Add filter at the top and keep only those metrics for which the group dimension is set to Standard. Finally, click Apply splitting and choose the Method field. The chart you see now shows the 90th percentile of Server’s HTTP response time, and it’s grouped by the HTTP method.
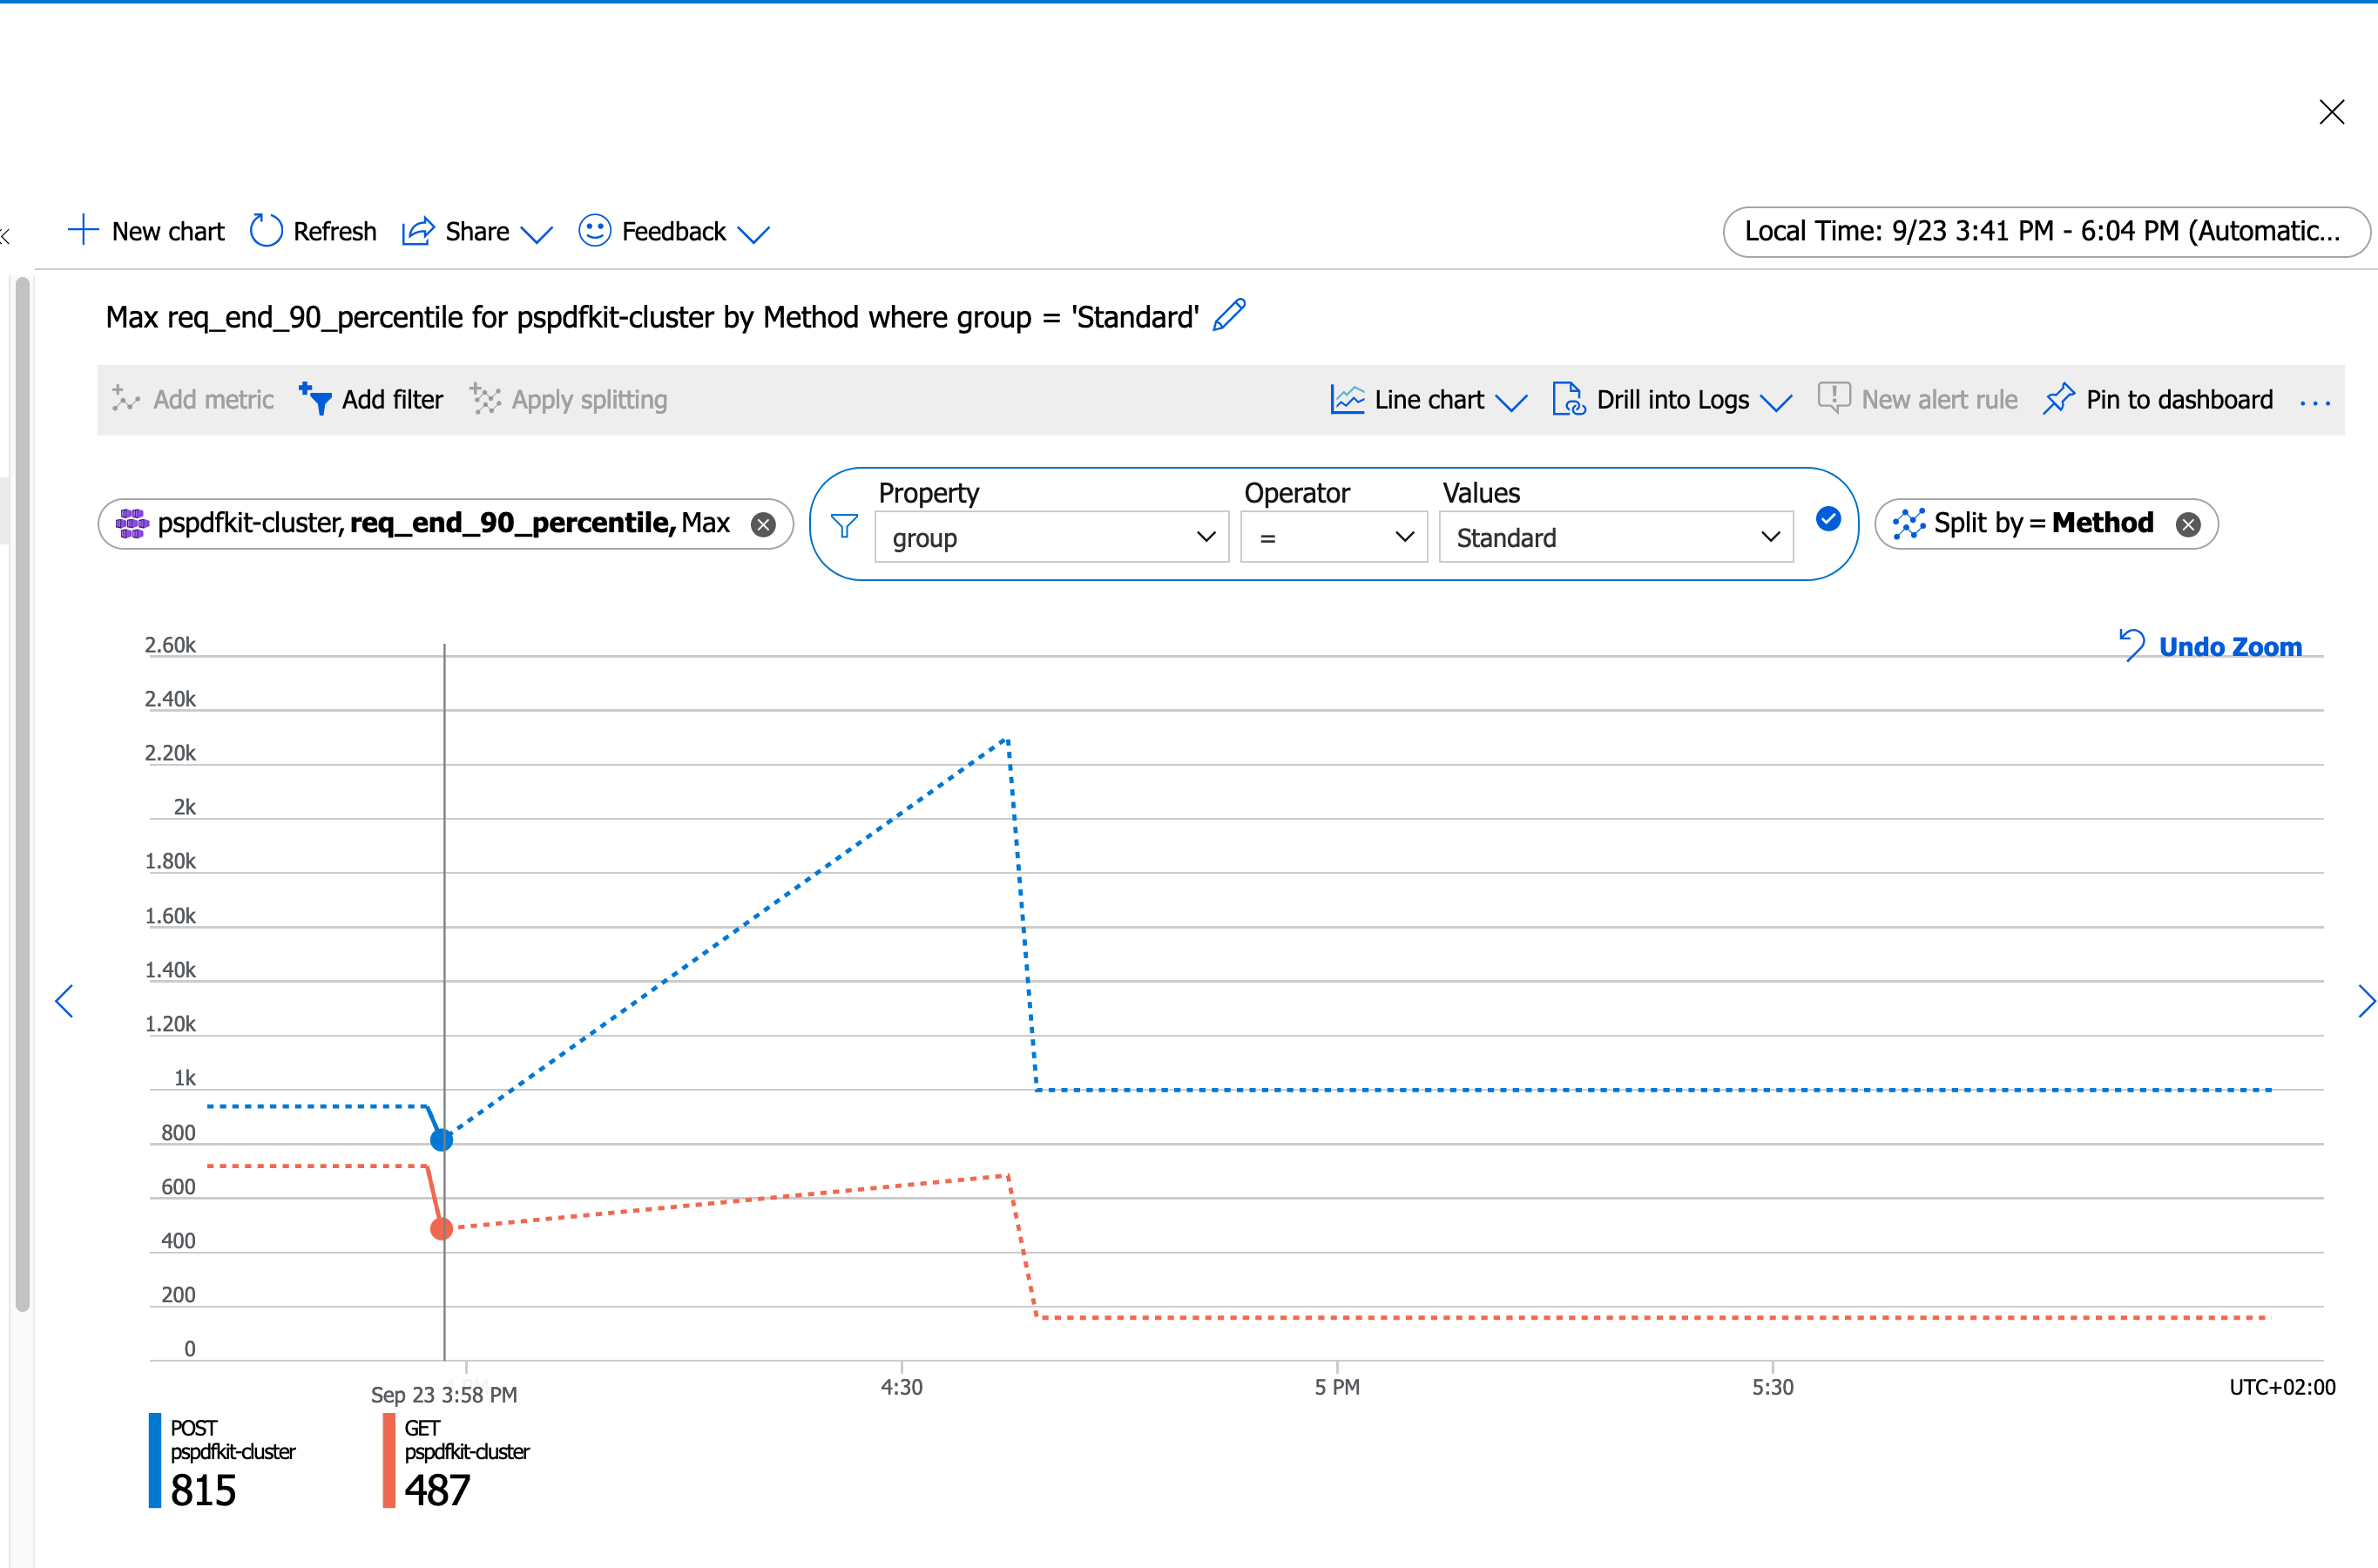
The data points you’ll see will most likely be different than what’s shown in the screenshot above.
ℹ️ Note: If there’s no data shown in the dashboard, open the Server dashboard at
<SERVER_URL>/dashboard, upload a couple documents, and perform some operations on them.
Now you can explore more PSPDFKit Server metrics. When you’re satisfied with how the chart looks, add it to the dashboard so that you can get back to it. You can learn more about building advanced charts by following the Advanced features of Azure Metrics Explorer guide.