Process Analysis: Qualitative vs. Quantitative
Table of contents

While preforming a process analysis you can analyze the processes by applying several techniques to gain insights into the current process's weaknesses and identify potential opportunities for redesigning the process. Qualitative analysis is used in cost/benefits analysis (for ROI purposes) like a sales order process. Quantitative process analysis in the BPM context is concerned with analyzing the process itself. Several techniques can be utilized for doing this, like a flow analysis.
What Is Process Analysis?
Process Analysis is one of the stages of Business Process Management (BPM). Within this stage, we can analyze the processes by applying several techniques to gain insights into the current process's weaknesses and identify potential opportunities for redesigning the process.
The BPM (Business Process Management) Process
Before we get into the details of process analysis, it is essential to understand where this fits into the overall BPM cycle. The critical stages in the cycle are:
- Process Discovery
- Process Analysis
- Process Redesign
- Process Implementation
- Process Monitoring & Control
These stages are better presented in the diagram below:

Process Analysis
The analysis stage looks at the current process to identify opportunities for process improvement. In the process analysis stage, many techniques are available to understand what is happening in the current (As-Is) process model. This analysis aims to identify weaknesses in the current process and the impact this may be having on the business outcomes. For example, in a sales order process, several orders are rejected by an automated Sales Order vetting process and thus sent for manual rework. The analysis would need to identify why these orders do not meet quality requirements in the first instance to eliminate the rework/correction process.
In this analysis stage, the techniques for evaluation can essentially be sub-divided into:
- Qualitative
- Quantitative
Both types of techniques are useful and deployed at some level in the final evaluation of the current process.
Before we delve into some of these techniques, it is vital to understand that they have specific meaning within the process analysis context. For instance, when qualitative is used in cost/benefits analysis (for ROI purposes), it means something very different from using it for Qualitative techniques within process analysis.
Qualitative Analysis Techniques
Several qualitative techniques are available to assess the current process. These include:
- Value Stream Mapping (Identifying Value-Adding & Non-Value adding activities)
- Waste Analysis
- Root-Cause Analysis
- Pareto Analysis
- Register of issues
When analyzing the current process, one or more of these may be applied depending upon the type of process and the desired outcomes.
Value Stream Mapping
Value Stream Mapping is one of the most common techniques applied and derived from all the work undertaken under 'Lean' and has its roots in the Toyota Production Management System(opens in a new tab) and, more generally, across the manufacturing industry. In its context under process analysis, it looks at all the steps within the process and critiques each step in-terms of its value-add from a customer-centric view. The customer may be internal to the organization or an external customer who pays for the product or service. This critique aims to nominate each step as value-adding or non-value-adding, with the intent of removing the non-value adding steps. The diagram below explains this in more detail.

Waste Analysis
This analysis again has roots in the Toyota Production System and is based on a famous quote:
"All we are doing is looking at the timeline, from the moment the customer gives us an order to the point when we collect the cash. We are reducing the timeline by reducing the non-value adding waste.”
Quote from Taiichi Ohno. Famous Toyota System Engineer.
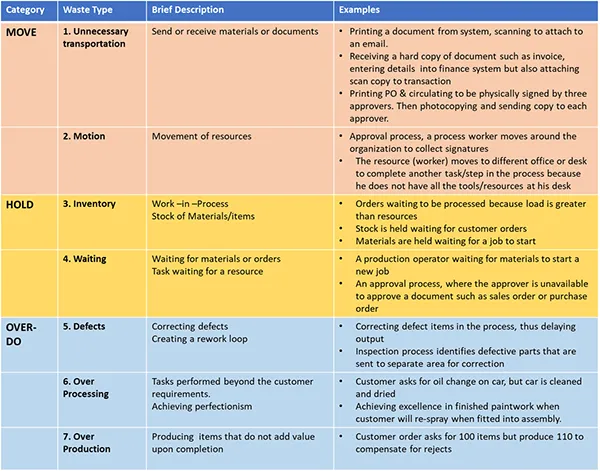
According to Ohno, waste can be categorized into seven areas as shown below:
- Move
- Unnecessary Transportation
- Motion
- Hold
- Inventory
- Waiting (and idleness)
- Over-do
- Defects
- Over -Processing
- Over-Production
The objective is to eliminate or minimize all waste. This may be done in incremental steps by applying varying techniques.
The chart below gives some examples of each waste type:
Pareto Analysis
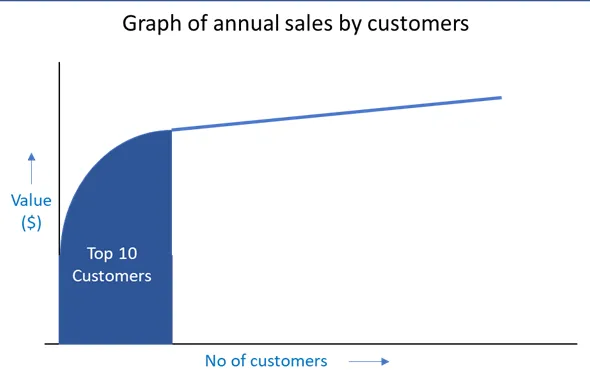
BPM Pareto analysis is a technique used to map and rank business process problems starting from the most frequent to the least frequent to focus efforts on the factors that produce the most significant impact overall. It's all about focus when we have lots of data or transactions. A good example is being able to identify top customers based on the total sales. An organization may have hundreds of customers, but when you analyze the annual sales by customer, you find that the top ten customers account for typically 70% -80% of the sales.
A Pareto graphical example is shown below:
Root Cause Analysis
Root cause analysis helps you think through the causes of a problem, including possible root causes—not just the symptoms before you start to think of a solution. It aims to identify all possible causes and not just the most obvious before removing the problem.
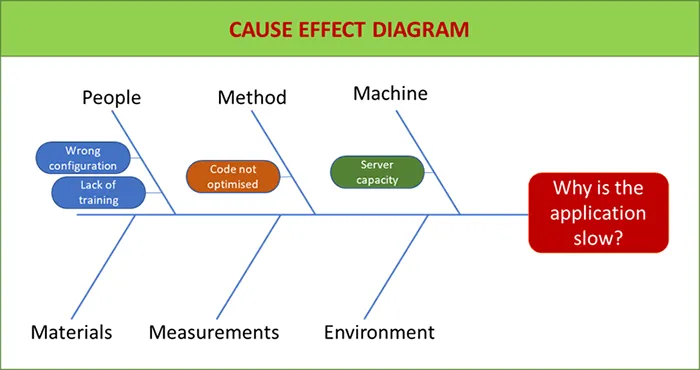
The two most popular ways to identify root cause is through a Root Cause diagram. They are sometimes known as Fishbone or Ishikawa diagram (from the name of the originator).
Again, these have their background in manufacturing and are now applied more broadly under lean principles in BPM analysis.
Example of Root Cause (Fishbone) diagram:
Register of Issues
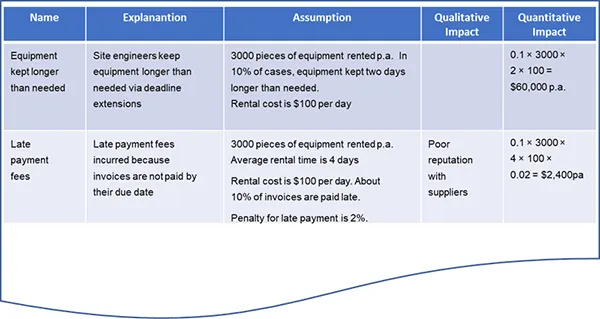
A register's objectives are to maintain a list of all the issues when using a process or system. Over a period, this data can then be analyzed and prioritized to identify the process's weaknesses. It is usually done when carrying out a process discovery exercise or when a new process has been installed, and issues that arise can be suitably monitored and addressed.
Example Register of Issues:
Quantitative Process Analysis
Quantitative process analysis in the BPM context is concerned with analyzing the process itself. Several techniques can be utilized for doing this. The most popular ones are listed below:
- Flow Analysis
- Queuing Theory
- Process simulation
Flow Analysis
Flow analysis is concerned with reviewing the current model for a process and calculating the cycle time (sometimes called Lead time) and efficiency. It targets to reduce or eliminate the non-value adding time.
This is shown for a simple sequential process below.
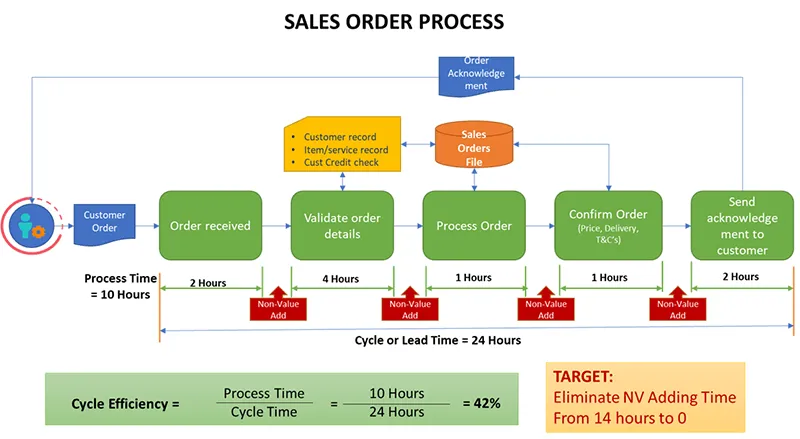
The advantage of flow analysis is that it quickly identifies the non-value adding activities and allows for a quick calculation of cycle efficiency. If we can estimate each activity's cost, we can also allocate a cost estimate for performing a process. Also, it allows us to calculate the load if we know how many times each activity occurs. This allows us to match our resource capacity against the workload to generate a workload profile against the given capacity.
One can calculate process performance by looking at each step or activity in the processor across the process cycle. It is possible to measure performance in terms of:
- Time
- Cost
- Quality
The disadvantage of flow analysis is:
- Not all processes are linear and sequentially. A complicated process structure can make it difficult to calculate a realistic cycle time. In the above example, if there was no customer master record for this order, then there is a separate process to create a new record before could proceed with the order. Adding the complexity of new master record creation and possibly a new sub-process for credit checks will make it difficult to calculate a realistic cycle time accurately.
- Does not consider the arrival rate of new orders?
- It also may not know how many resources are available to perform this process. There may be dedicated resources, but other people may support it if a backlog is created.
As part of the flow analysis, we can calculate resource utilization by the simple formula of:
Resource Utilization = Time spent on process work (for each process) / Time available for process work.
Queuing Theory
Queuing theory is the mathematical study of the congestion and delays of waiting in line. Queuing theory can help users and process designers make informed business decisions on building efficient and cost-effective workflow systems. It is particularly suited for assessing the resources required to give a defined service level. For example, large takeaway food outlets (such as Burger King or KFC) apply this theory to ensure a desired service level at the counter and ensure the customer is not waiting for a longer than a set target period. It is also applicable for Emergency Response System, such as in a hospital, to ensure that sufficient medical doctors are available at any given time. Further reading of the subject is available under Operations Research.
Process simulation
Process simulation takes the current process model (as-is process). It builds a future state model (To-Be) by allowing several ‘What-If’ scenarios to identify an optimum future state process model.
Conclusion/Summary
There is an array of techniques available for process analysis. We have highlighted some of the most popular ones above.
It does not mean that you must use all of them to identify potential opportunities to be successful. On the contrary, some of the most dramatic process changes have been made by applying simple techniques. As an example, Value stream mapping on its own is a powerful technique if used successfully.
The approach must be in alignment with the type of process and the objectives of the project. The outcome must be commensurate with the effort deployed.
Remember, the analysis is the means to the end, not the end itself. Good luck with your approach, and stay focussed on getting some positive outcomes from this stage that you take into the BPM cycle redesign stage.
Reference & further reading: Fundamentals of Business Process Management, 2nd edition, by M. Dumas, M. La Rosa, J. Mendling, and H. Reijers(opens in a new tab)

Mike Raia
Marketing the world's best workflow automation software and drinking way too much coffee. Connect with me on LinkedIn at https://www.linkedin.com/in/michaelraia/(opens in a new tab)


