


Process metrics and KPIs explained
Table of contents

Organizations striving to improve their processes need clear, measurable indicators to track performance and progress. Key performance indicators (KPIs) and metrics serve as the foundation for understanding how well a process is functioning and where adjustments are needed. When applied thoughtfully, they become powerful tools for aligning teams, identifying inefficiencies, and driving continuous improvement.
Measurement definitions
To avoid confusion, it’s important to distinguish between the two terms:
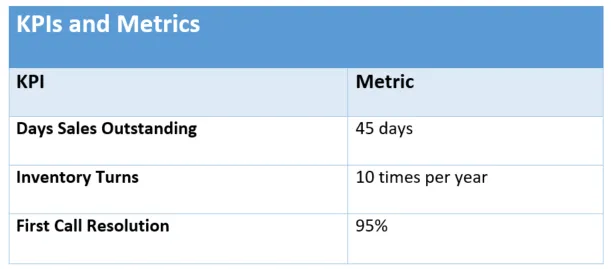
A key performance indicator (KPI) is a measurable factor that indicates how effectively an organization is meeting its business objectives.
A metric is the specific value used to evaluate a KPI, and it’s typically defined by a current state, a target goal, and a deadline for reaching that goal.
This table gives some examples and shows how the two are related.
A process improvement initiative could use these KPIs and metrics to state its goals in the following way:
- Reduce days sales outstanding from 45 to 30 by the end of 2020.
- Increase inventory turns from 4 to 7 by the end of Q4.
- Increase first customer support call resolution from 85 percent to 90 percent by June 30.
Better still, it could state the goals in phases, for example:
- Reduce days sales outstanding from its current value of 45 to 30 by the end of Q1, 25 by the end of Q2, and 20 by the end of Q3.
Who will use these process metrics?
Before a report is created or a KPI is decided on, it’s important to ask “Who will use this information, and what action will be taken based on it?” This can reduce “report creep” drastically, as information is bucketed into categories such as “actionable” and “nice to know.”
To do this, start by determining who needs the information:
- Process owners
- Executives
- Process stakeholders
- Process users
Each group might need different information presented in different ways to make it more effective. Once you decide who has access to specific reports and dashboards, agree on how the information will be used.
What you can measure
- Efficiency/process cycle-time improvement
- Effectiveness/increased customer satisfaction
- Capacity/producing more
- Productivity/cost reduction
- Quality
- Profitability/revenue improvement
Establish tolerance levels
You’ll need to establish the tolerance level of your KPIs. In other words, ask yourself: “What values outside the expected range are critical, requiring corrective action?” These are often displayed as green, yellow, and red zones in a gauge. They might also be called RAG (red, amber, green) statuses.
Discover ready‑to‑use workflow automation templates that streamline your core processes with end‑to‑end automation.
So what tolerance levels are you comfortable with? Some companies may start at +/- 10 percent, depending on the goal. For a constantly measured goal, like response time, you could start with red at -20 percent, yellow at -10 percent, and green at the goal response time. You might, in fact, pilot these percentages without sharing the results — on a management-only dashboard, for instance — to see how often response time falls out of range before making a final decision.
The predictability of the metric may dictate tighter measurement, say 2 to 3 percent variation. This also might be based on how damaging these variations can be to the business. A few percentage points out of range for a highly-regulated process could be enough to require immediate reaction.
Once the appropriate tolerance levels are agreed upon, they must be communicated and shared with all stakeholders. Decide how you’ll handle performance and how often you’ll review it with frontline employees. What will the repercussions and plans for moving forward be? It’s best to clarify this upfront.
Note: Leading and lagging indicators
- A leading indicator points toward future actions. For example, the number of open customer service inquiries is a leading indicator. These indicators can provide agility in staging interventions that move the needle in the right direction in real time.
- A lagging indicator assesses past performance. For example, last month’s first call resolution percentage is an indicator of past performance. Lagging indicators are usually easier to track, as long as there’s a means to access and analyze accurate historical data.
Be SMART when you choose metrics
When using any methodology for defining metrics, keep the popular SMART model in mind:
- Metrics should be specific and tied to business goals.
- Metrics should be meaningful and measurable. The underlying data elements must be captured accurately and completely, and the calculation must be correct. If you cannot measure it or report on it from your current enterprise systems, consider the tradeoff in business value vs. manual effort, or report development before including it in your list of metrics.
- The target values for your metric must be realistically achievable. Do the right people have the ability and authority to drive the metric toward the target value?
- Metrics should be realistic, relevant, and results-oriented. Are there identified actions that can drive the metric toward its target value?
- Metrics need to be timely, especially if they’re leading indicator metrics. Can reports be generated, or can dashboards be updated in time to allow appropriate interventions to drive the metric toward its goal?
More process KPI examples
- Average process time
- Average time per task
- Average time to complete a task
- Number accepted/rejected
- Number in queue in stages
- Number of complaints
- Number of errors
- Number of escalations
- Number of late tasks
- Number of requests
- Number of tasks sent for rework
- Percentage of overdue tasks
- Percentage of processes below/above goal
- Requested vs. budgeted
- Requests by type
- Time from request to fulfillment
- The volume of tasks per staff
Conclusion
Defining and tracking the right KPIs and process metrics is essential for any organization aiming to improve performance, efficiency, and accountability. When you align your metrics with clear business objectives, understand who will use the data, and establish meaningful tolerance levels, you create a foundation for data-driven decision-making and continuous improvement.
Whether you’re launching a new initiative or refining existing workflows, KPIs and metrics are not just numbers — they’re tools for clarity, alignment, and progress. Take the time to measure what matters, and your processes will follow.
