Hints for Beginners Navigating Around New Code
Table of contents

We’ve all had the experience of starting on a project that’s new to us and then being introduced to an already established codebase. This can be overwhelming or confusing, especially if you’re a beginner, so the purpose of this article is to give you an idea of what to be aware of when you are starting with code you are unfamiliar with.
Ask Questions
When you start working on a project that’s already underway, it’s natural to have a lot of questions, and it’s important to ask them.
Architectural Questions
One of the first things to ask is about architectural patterns, such as MVP, MVVM, or whatever else the developers decided to use. There might be a mix of patterns, such as some that are partially used, or one specific one which is used more frequently than others. Try to familiarize yourself with them.
Legacy Monsters
Legacy monsters are old sections of code (maybe a helper class, maybe multiple classes, or maybe an entire library) that were written either a long time ago or by some mysterious person who no longer works on the project. Generally, these are so big/complicated/badly designed that nobody quite understands how they work. So it’s important that you quickly establish the extent of these legacy monsters and how they are connected to the rest of the codebase.
Frequently Used Libraries
Ask about libraries the project already includes, along with their purposes, so you don’t end up manually implementing functionality that a library already provides. For example, if Picasso(opens in a new tab) is already in use, you won’t need to implement your own bitmap cache or image scaling routines.
Folder Structure and Hotkeys
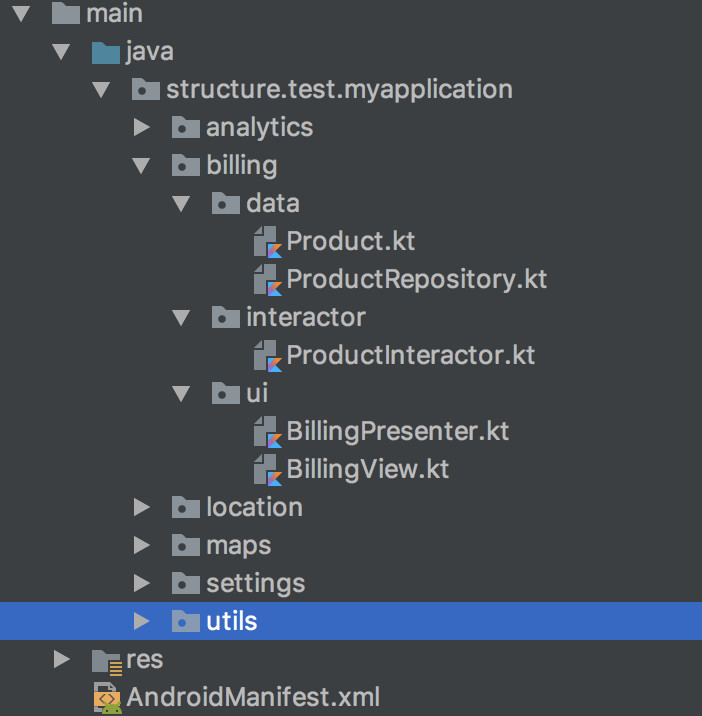
If you are presented with a good folder structure, check it out. In general, the more folders in the code, the better the structure. The structure can be architecture based, feature based, or both.

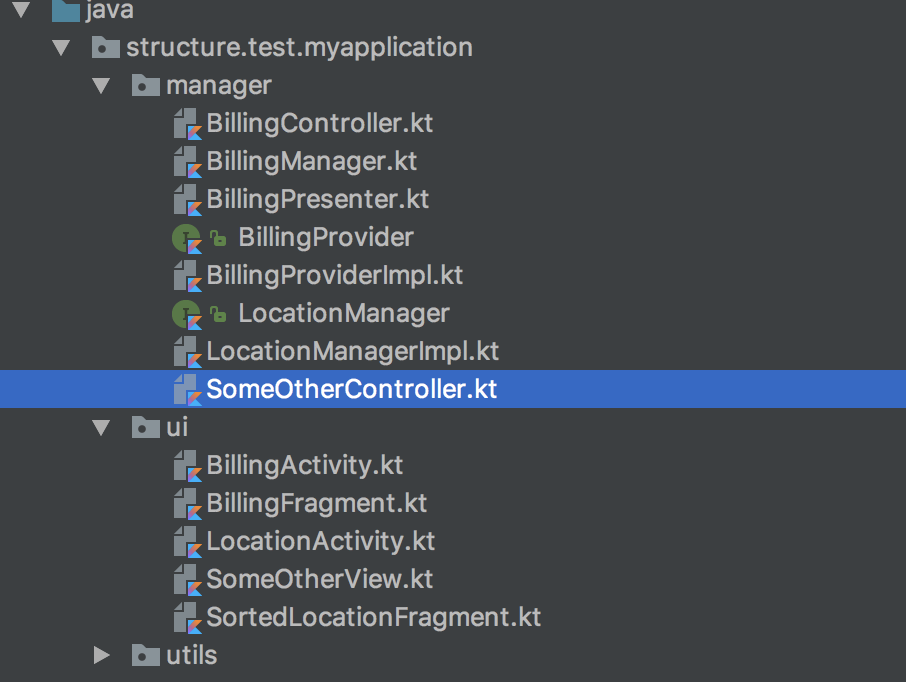
Sometimes the folder structure isn’t so good:

In such a case, you should rely on hotkeys and try to familiarize yourself with the general terms and operations.
| Function | macOS | Windows |
|---|---|---|
| Open a class | cmd + o | ctrl + n |
| Open a file | cmd + shift + o | ctrl + shift + n |
| Open a symbol | cmd + alt + o | alt + shift + n |
All of the above shortcuts support partial matching, so you don’t need to know an exact name.
Layout Inspector
Layout Inspector allows you to check what is currently showing on the screen of the emulator or device. Go to Tools > Android > Layout Inspector, and you will be presented with a drop-down list for choosing which view hierarchy to capture.

The view hierarchy itself allows you to get an idea of the current layout components and their view properties. The important ones are IDs, current sizing, and visibility.

Use IDs and string resource IDs to match screens of interest with the code by performing a search for them later on. Find in Path is useful for performing such searches.
| Function | macOS | Windows |
|---|---|---|
| Find in Path | cmd + shift + f | ctrl + shift + f |
Android Studio Investigation Tricks
Bookmarks
Bookmarks are super helpful when scouting around the new code, while trying to trace a tricky call chain, or when looking for a proper place for a bug fix, because they allow you to keep track of points of interests you’ve discovered and might want to revisit.
| Function | macOS | Windows |
|---|---|---|
| Place a bookmark on the code line | f3 | f11 |
| View all of your bookmarks | cmd + f3 | shift + f11 |
| Add labels while viewing bookmarks | cmd + enter | ctrl + enter |
Navigate Backward/Forward
Navigating backward and forward allows you to traverse through places in code you’ve recently visited. Just give it a try to understand how it works.
| Function | macOS | Windows |
|---|---|---|
| Navigate backward and forward | cmd + alt + left/right | ctrl + alt + left/right |
Recent Files
You can choose to show a popup for recent files.
| Function | macOS | Windows |
|---|---|---|
| Show recently viewed files | cmd + e | ctrl + e |
| Show recently edited files | cmd + shift + e | ctrl + shift + e |
Both of the above support name filtering once you start typing.
Android Studio Tricks for Debugging
Conditional Breakpoints
| Function | macOS | Windows |
|---|---|---|
| Place a breakpoint | cmd + f8 | ctrl + f8 |
You can right-click to make a conditional breakpoint.

Logging Using Breakpoints
Android Studio also offers a way to put logs in your code without changing a single line of it. Check out our blog post, The Subtle Art of Real-Time Debugging with Android Studio, for more details.
Evaluate Expression
This allows you to evaluate pretty much any valid Java expression during debugging. But be aware that if you are changing any object states, they will remain changed when you resume the execution of the program.
| Function | macOS | Windows |
|---|---|---|
| Invoke the popup | option + f8 | alt + f8 |

Conclusion
This article provided some tips and tricks for beginners navigating around new code. I hope it was helpful and will ease you into exploring your new codebase!


