Continuous iOS Code Coverage With Jenkins and Slather
Table of contents
We at PSPDFKit are big believers in automated testing. Unit tests, UI automation tests, snapshot tests, you name it, we do it all. Whenever you are dealing with a code base this large, it quickly becomes impossible to do effective work without the pleasant assurance of having a large test suite behind you, ensuring you are not doing more harm than good with your latest refactoring. However, if we want to ensure that we are actually testing all the crucial code segments, we need a way to visualize what has been actually touched by our test code and what has not. This is where code coverage comes into play.
Xcode 7
With the introduction of Xcode 7, Apple made it really easy to get started with code coverage. All it takes is flipping a switch on the test action of your scheme and you are good to go.
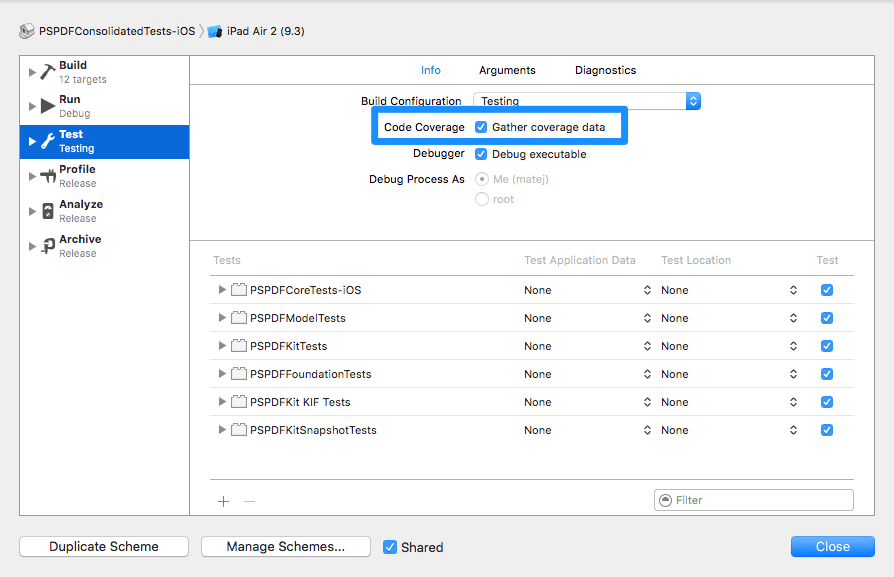
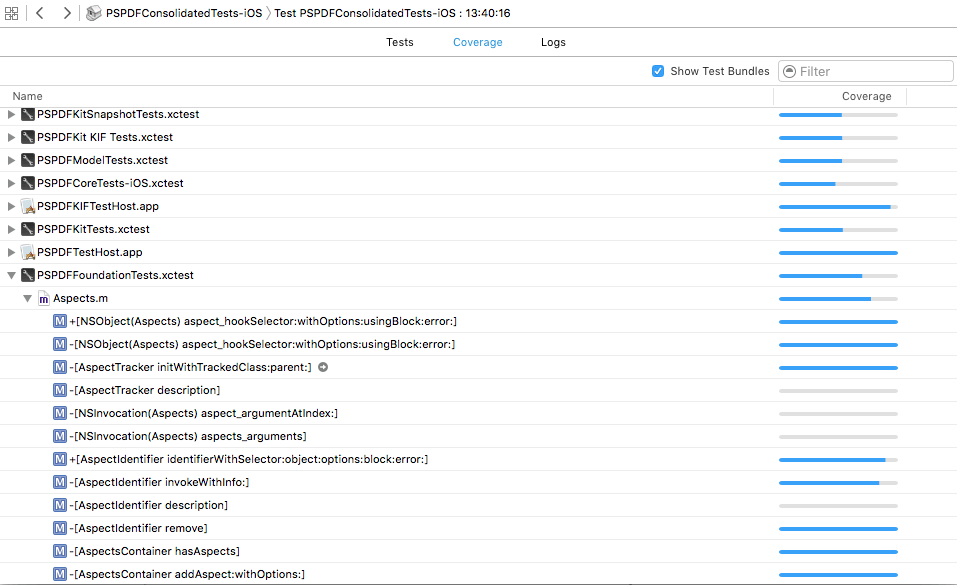
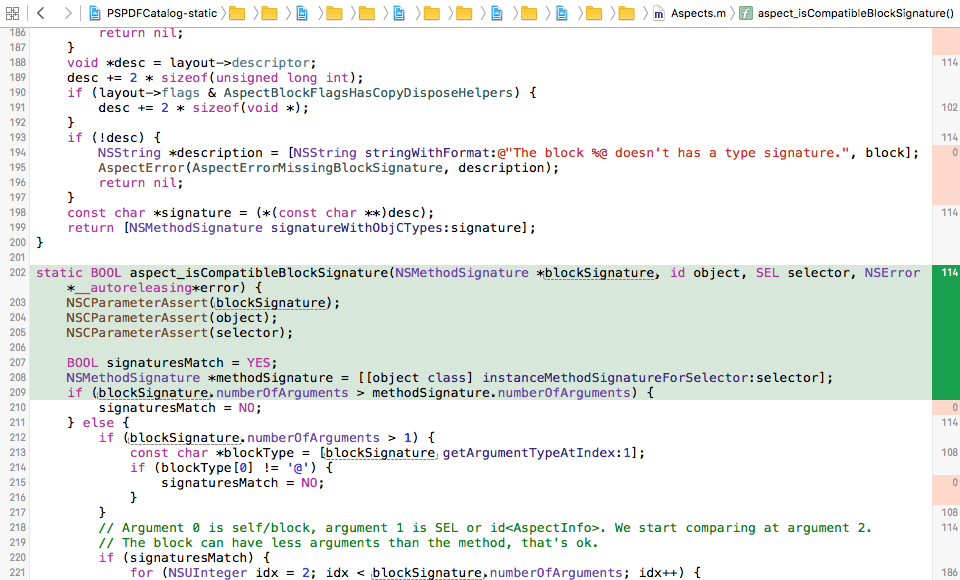
For a simple project that is all you need to do. You no longer need to fiddle around with custom build configurations and hunt for the right compiler flags. Also, there’s no longer a need to use extra command line tools to convert the coverage data into something you can actually read. The UI is now built right into Xcode. Check out WWDC 2015 Session 410(opens in a new tab) to learn more about this great Xcode 7 feature.
Continuous Code Coverage
Code coverage data alone means nothing, if you are not constantly keeping track of it. Once your tests suite grows to something near the scale we are working at this can become harder than one might think. Our tests, even with ludicrous speed enabled, take about 10 minutes to complete for one configuration. Typically, we are testing all the major iOS versions we support on both the iPhone and iPad. Unsurprisingly, we don’t run the full test suite locally very often. Luckily, Xcode 7 has you covered here as well. If you are using Xcode Server(opens in a new tab) then you will again get coverage reports directly inside your favorite Apple IDE. However, at PSPDFKit, we do not use Xcode Server. There are multiple reasons for this but mainly it boils down to the fact that it simply does not work with our GitHub based workflow. Even with third party tools, like Buildasaur(opens in a new tab), it all just takes way too long for our massive mono-repo. Instead of Xcode Server, we rely on Jenkins for all our continuous integration needs.
Before Xcode 7, we already had code coverage reporting set up with Jenkins. We generated coverage data in the gcov format and used LCOV(opens in a new tab) together with a custom script to integrate the coverage data into Jenkins. It all worked pretty well. However, with the introduction of Xcode 7, Apple dropped support for the legacy gcc coverage file format and introduced a format of its own: profdata. Of course this broke our setup as soon as we migrated our CI servers to Xcode 7. As framework developers, we always have to be early adopters of the latest iOS versions, so we can make sure our code is ready before our clients make the switch. Unfortunately, this means in some cases we need to make a few compromises. In this particular circumstance, it meant dropping code coverage because there were simply no convenient tools around to get the data into Jenkins. Xcode ships with llvm-cov, a command line tool that can convert the coverage data into a more human readable format. However, there is still quite a bit of work needed to get it into a format that Jenkins could handle. We still had coverage enabled locally, but due to the aforementioned test suite run times, it wasn’t much help.
Soon after we discovered Slather(opens in a new tab), a great little Ruby tool that can convert gcc coverage data to various other formats, we saw there was some work underway for it to handle the new profdata format. Unfortunately, we had bigger fish to fry at that time, so we couldn’t help much but continued to keep one eye on the progress being made.
We have been flying blind for over a year now, so it really was time to finally get code coverage back on track. There have been some great new additions(opens in a new tab) made to Slather recently, so it seemed like a good time to give it a try.
Setting Up Slather
Slather comes with a good README(opens in a new tab) that should help you get set up quickly. It supports various services and formats, including Codecov(opens in a new tab), Coveralls(opens in a new tab), Travis CI Pro(opens in a new tab), TeamCity(opens in a new tab), Cobertura(opens in a new tab), static HTML(opens in a new tab) as well as outputting a quick summary to standard output. For our setup, we were mostly interested in the Cobertura XML format. Jenkins has a decent Cobertura plugin(opens in a new tab), which is what we had used with our previous setup. Like most things with Jenkins, it does not look all that great but it gets the job done.
We already used a Rake script to drive our command line builds, so getting Slather in as a dependency was pretty straightforward. We wanted the latest and greatest features so we set up our Gemfile to use the latest master version:
gem 'slather', github: "SlatherOrg/slather"You can pass in configuration options to Slather as command line arguments or put them inside a .slather.yml file. In our setup, we use a combination of both. In most cases you should be fine with just putting everything in .slather.yml, but we also pass some dynamic parameters when executing the command via Rake.
Here is our .slather.yml:
input_format: profdatacoverage_service: cobertura_xmloutput_directory: slather-reportscheme: PSPDFConsolidatedTests-iOSworkspace: PSPDFKit.xcworkspacexcodeproj: PSPDFKit-Tests.xcodeprojignore: - ../**/*/Xcode* - ../core/* - PSPDFKit-Tests/* - PSPDFKit/PSPDFModel/PSPDFModelTests/* - PSPDFKit/PSPDFModel/Vendor/*One thing to note here is that we use a custom project for our tests, PSPDFKit-Tests.xcodeproj. Normally tests would be part of your main app project. However, back in the day when we distributed source code builds, we decided to separate them out so they were not included in those builds. Now a days, our setup is actually even more complex than before. Our main workspace is made up of several projects that build multiple static libraries (libPSPDFCore.a, libPSPDFModel.a, libPSPDFKitFoundation.a, libPSPDFKit.a, etc.), which together make up our main product: the PSPDFKit framework. Most of those libraries also have Mac-specific targets and some also have targets with special tweaks. Pretty much every one of those targets then has one or more dedicated test host apps that run test bundles for the particular library. It’s all pretty complicated. In fact, it is too complicated for Slather’s automatic binary lookup to make sense of it, so we have to pass in explicit paths to the test binaries we are interested in. Do not worry as this is something that should work out of the box for a simpler setup. Despite the complex workspace structure, simply passing in one of our projects is enough to make Slather happy.
Our coverage Rake task looks somewhat like this:
def coverage_ios  config = YAML.load_file('.slather.yml')  build_settings = `xcodebuild -workspace #{config['workspace']} -scheme #{config['scheme']} -showBuildSettings`  if build_settings    derived_data_path = build_settings.match(/ OBJROOT = (.+)/)[1]    binary_file_prfix = "--binary-file \"#{derived_data_path}/CodeCoverage/Products/Testing-iphonesimulator"
    pspdfkit_tests_binary = "#{binary_file_prfix}/PSPDFTestHost.app/PlugIns/PSPDFKitTests.xctest/PSPDFKitTests\""    pspdfmodel_tests_binary = "#{binary_file_prfix}/PSPDFModel-TestHost.app/PlugIns/PSPDFModelTests.xctest/PSPDFModelTests\""    pspdffoundation_tests_binary = "#{binary_file_prfix}/PSPDFFoundation-TestHost.app/PlugIns/PSPDFFoundationTests.xctest/PSPDFFoundationTests\""    pspdfkit_kif_tests_binary = "#{binary_file_prfix}/PSPDFKIFTestHost.app/PlugIns/PSPDFKit KIF Tests.xctest/PSPDFKit KIF Tests\""    pspdfcore_tests_binary = "#{binary_file_prfix}/PSPDFCore-TestHost-iOS.app/PlugIns/PSPDFCoreTests-iOS.xctest/PSPDFCoreTests-iOS\""
    run_cmd "slather coverage #{pspdfkit_tests_binary} #{pspdfmodel_tests_binary} #{pspdffoundation_tests_binary} #{pspdfkit_kif_tests_binary} #{pspdfcore_tests_binary}"  endend
It first looks up the directory where our coverage data is stored, which is normally inside the Xcode derived data directory. Something like /Library/Developer/Xcode/DerivedData/PSPDFKit-{some_unique_id}/Build/Intermediates/CodeCoverage. The directory will contain a merged prodata file with the coverage execution counts for all the tests and subdirectories where your build products reside. When building with code coverage enabled, the compiler will build instrumented object files that produce the coverage data and contain some extra data necessary to map the execution counts to the actual source code. If you are curious about exactly how that works, you can check out the LLVM documentation(opens in a new tab) for some interesting light reading.
Since we are building static libraries, the relevant code will be embedded into the individual test binaries. This means that we are not really interested in the produced .a files, but rather need to look up the binaries that reside inside the .xctest bundles inside our test host apps. Basically, this is all the above code does. It leverages Slather’s newly gained ability to process multiple binary files(opens in a new tab) in a row and then combine the output into one XML file that we pass into the Cobertura Jenkins plugin. It does that by essentially repeatedly invoking llvm-cov with the Coverage.profdata file Xcode generated for us and the binaries we pass in.
You can try llvm-cov easily by going into the mentioned CodeCoverage directory and running:
xcrun llvm-cov show -instr-profile Coverage.profdata <relative_path_to_your_binary>The coverage data is of course only generated after your tests run, so be sure to run your test suite before.
After running llvm-cov Slather parses the output data, processes it a bit and then outputs it into one of the supported formats. In our case an XML file suitable for Cobertura.
Jenkins
To get all that running on Jenkins, we simply added a call to rake coverage_ios right after we run our test suite. We have some extra logic to prevent coverage from running in certain configurations or if the tests fail but that is essentially all that is needed to generate the XML coverage data. After adding the call, we just need to install the Cobertura plugin(opens in a new tab) and configure it so it can find the generated XML.

One detail you need to keep in mind here is that the Cobertura plugin does not work well with the new Jenkins Agent Access Control. If you want to use the plugin, you will have to disable this feature or add exclusion rules for it.
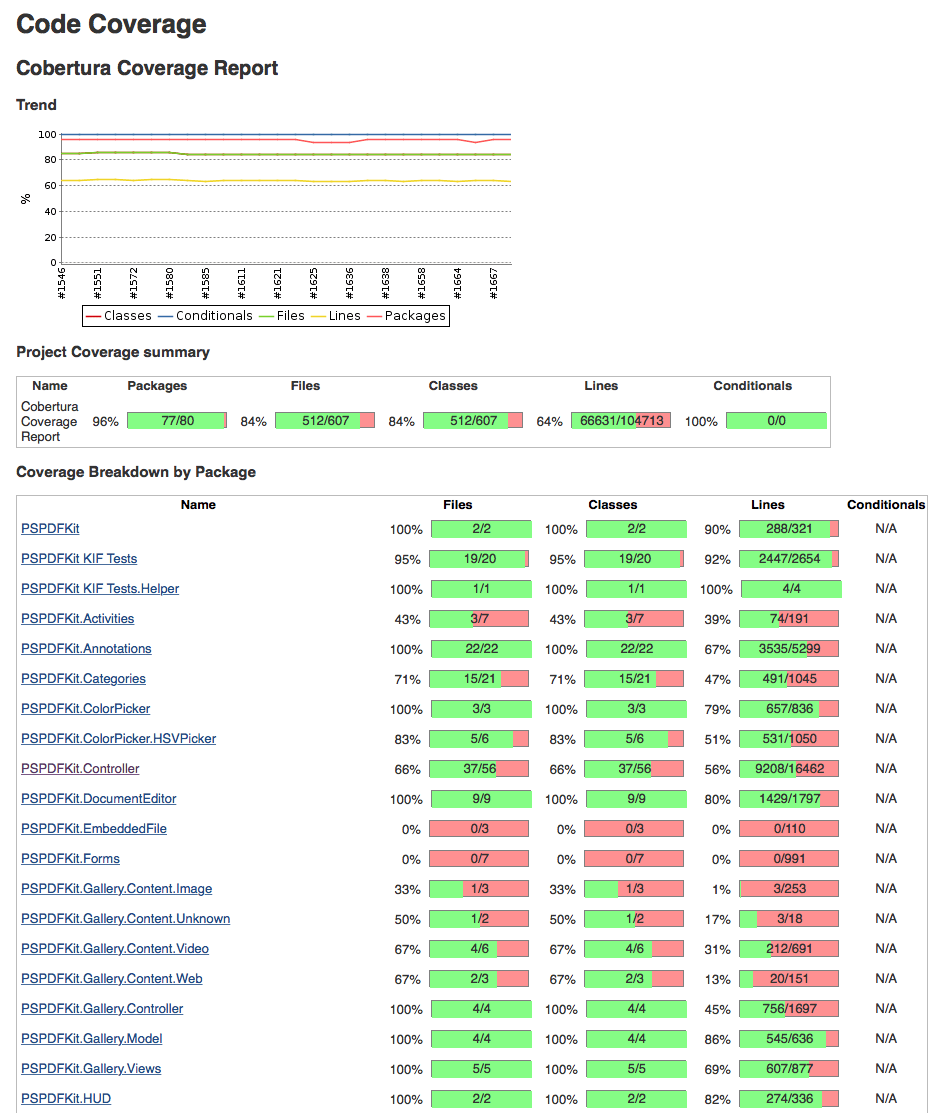
If everything works out then you should get a new section on your Jenkins job pages with generated coverage data.
Missing Files
At this stage of the game, we are used to doing extra work when adding a new puzzle piece to our build process. Code coverage was no different. We noticed that while coverage generation was working locally, it did not work at all on our Jenkins servers. It turned out that in some cases our binaries reference additional temporary files that do not get included in the coverage data. Those appear to be a side affect of using ccache to speed up our builds.
warning The file '/Users/ci/.ccache/tmp/CALayer-KI.stdout.macmini08.92540.QAQaxt.mi' isn't covered.The warnings confused Slather, which parsed the entire line as a filename string and crashed once it had to resolve the invalid path. Why we were seeing those warnings show up only on our Jenkins nodes and not locally is still a bit of a mystery, but simply patching Slather to ignore warnings like this seems to fix it here.
Performance
Another thing that we noticed early was that the processing time degraded badly when we added additional binaries to our setup. Even though we were focusing only on our iOS code, we were seeing that coverage generation took between 2-3 minutes even on fairly powerful hardware. Adding additional file filters to Slather did not help. After doing some profiling, we quickly realized that the bottleneck was not Slather but the underlying llvm-cov command line tool. The code base was simply large enough to require that amount of time. llvm-cov does have an option to specify source file filters, but the functionality is limited to specifying the source files we want to process and not specifying rules for files which we want to ignore. Therefore, Slather had to process all the files and then throw away the files that were in the ignore lists. We decide to make this a bit better.
Our solution was to add an option, which can be used to specify the source files we are interested in beforehand. This means extending the .slather.yml with another option which in our case looks like this:
source_files: "./**/*.{m,mm,swift}"The above basically instructs Slather to recursively look up all Objective-C, Objective-C++ and Swift files in our projects. By recursively looking up all those files, it excluded a large amount of C++ files in our Core layer and some C++ dependencies. In addition, it also excluded some system and test files that are otherwise processed. llvm-cov was then limited to processing only those files.
This alone noticeably improved the performance for our setup. However, the key to bringing the processing time down is what we can now do with the file list inside Slather. In addition to limiting source files, we can also filter out all files matching existing Slather ignore patterns before they are ever processed by llvm-cov. When multiple binary files need to be processed, we can also remove all the files that were already processed and make the list of files shorter as we progress through the binary files. Both of these, especially the later, resulted in big gains for us. Since our higher level libraries (like PSPDFKit) build on the underlying layers (like PSPDFModel) there is quite a bit of overlap between the coverage of our individual tests targets. A concrete example would be UI tests. When doing UI tests, you obviously implicitly touch the model files and add coverage to sections that can already be covered by unit tests. Since the coverage data is merged into a single profile file, we will get the same coverage data regardless of which binary is used to map the coverage data to the relevant source files. We thus do not have to process files multiple times.
All these things together resulted in the processing time coming down to about 30-40 seconds. We pushed the new option and our fixes(opens in a new tab) back to upstream, so anyone can now benefit from them.
Open Issues
One thing we still haven’t quite figured out are some llvm-cov warnings related to functions with “mismatched data”.
warning: 364 functions have mismatched data.We get this for most of our test binaries, but not all of them. Despite the warnings, we have not really found any irregularities in the produced coverage report. Looking at the llvm source code reveals that those warnings are printed out when the function structural hashes do not match up between the coverage data and the processed binaries. Other than that, there is not much information available on the subject. Our best guess so far is that this could be a side affect of our static library hierarchy, where the same code essentially gets linked into our test binaries in different ways. We tried contacting Apple DTS, hoping that we would be able to reach some LLVM people to help us out, however the request was rejected, as DTS does not handle LLVM issues.
Another thing we are not quite happy with yet is the time it takes for the Cobertura plugin to process and upload the coverage data. We have not yet looked into that closely, but one alternative we have on the table is to simply switch to a code coverage service and use that instead.


