Debugging WebView in UWP Apps with Edge DevTools

Visual Studio is a fantastic IDE with rich debugging tools that make every developer’s life much easier. Developing your UWP(opens in a new tab) apps and debugging managed or native code with Visual Studio is a breeze. Simply choose the debugger type in your project’s debug settings, start debugging, and away you go. In a mixed code app, you can debug managed code and native code independently, or you can debug both at the same time.
However, like any massively complex development tool, Visual Studio is not without its shortcomings. If you add a WebView to your app, you may need to debug JavaScript and inspect CSS and HTML. Visual Studio does have a Script debugger type, but it’s slow, it’s limited, and it can’t be debugged while debugging managed or native code.
In this blog post, I’ll show you how to use the new support in the Microsoft Edge DevTools Preview(opens in a new tab) app for WebView content hosted in UWP apps to improve your debugging experience.
Prerequisites
In order to use the Edge DevTools Preview app for debugging WebView content, you must have OS Build 16299.579(opens in a new tab) of Windows 10 or later. Install the Microsoft Edge DevTools Preview(opens in a new tab) app, which is available in the Microsoft App Store.
Debugging
When using the Script debugger type, you do have access to a JavaScript Console and DOM explorer; however, it’s not possible to simultaneously debug managed or native code. Additionally, these views tend to be slow and unreliable in my experience, and they lack all the features and general usability of the Edge DevTools.
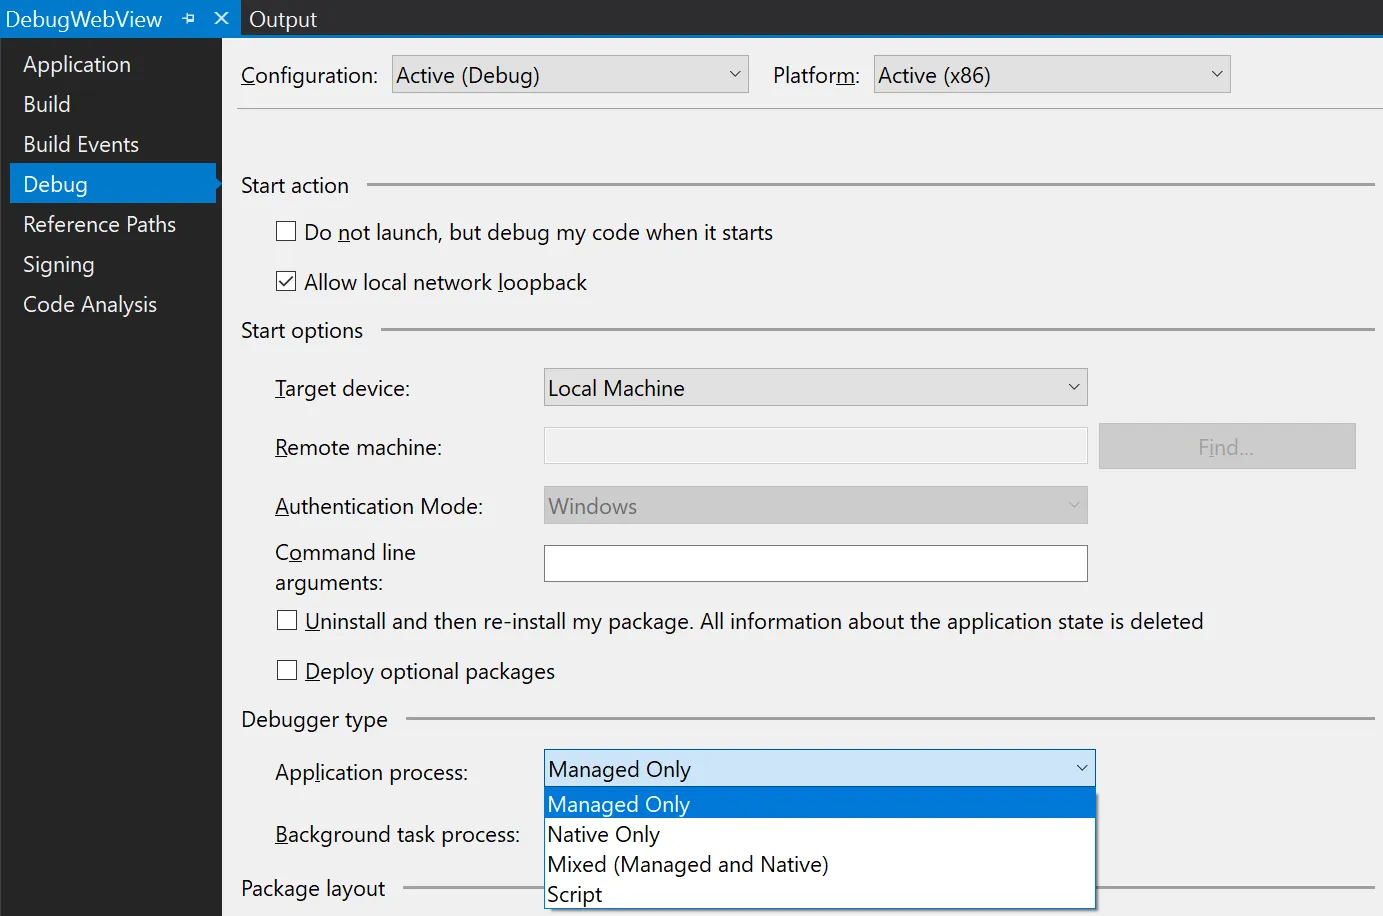
To debug with the Edge DevTools, set your debugger type to any type other than Script and start debugging the app. Once the app is launched, start the Edge DevTools, or if it’s already running, click on Refresh in the top right of the app.

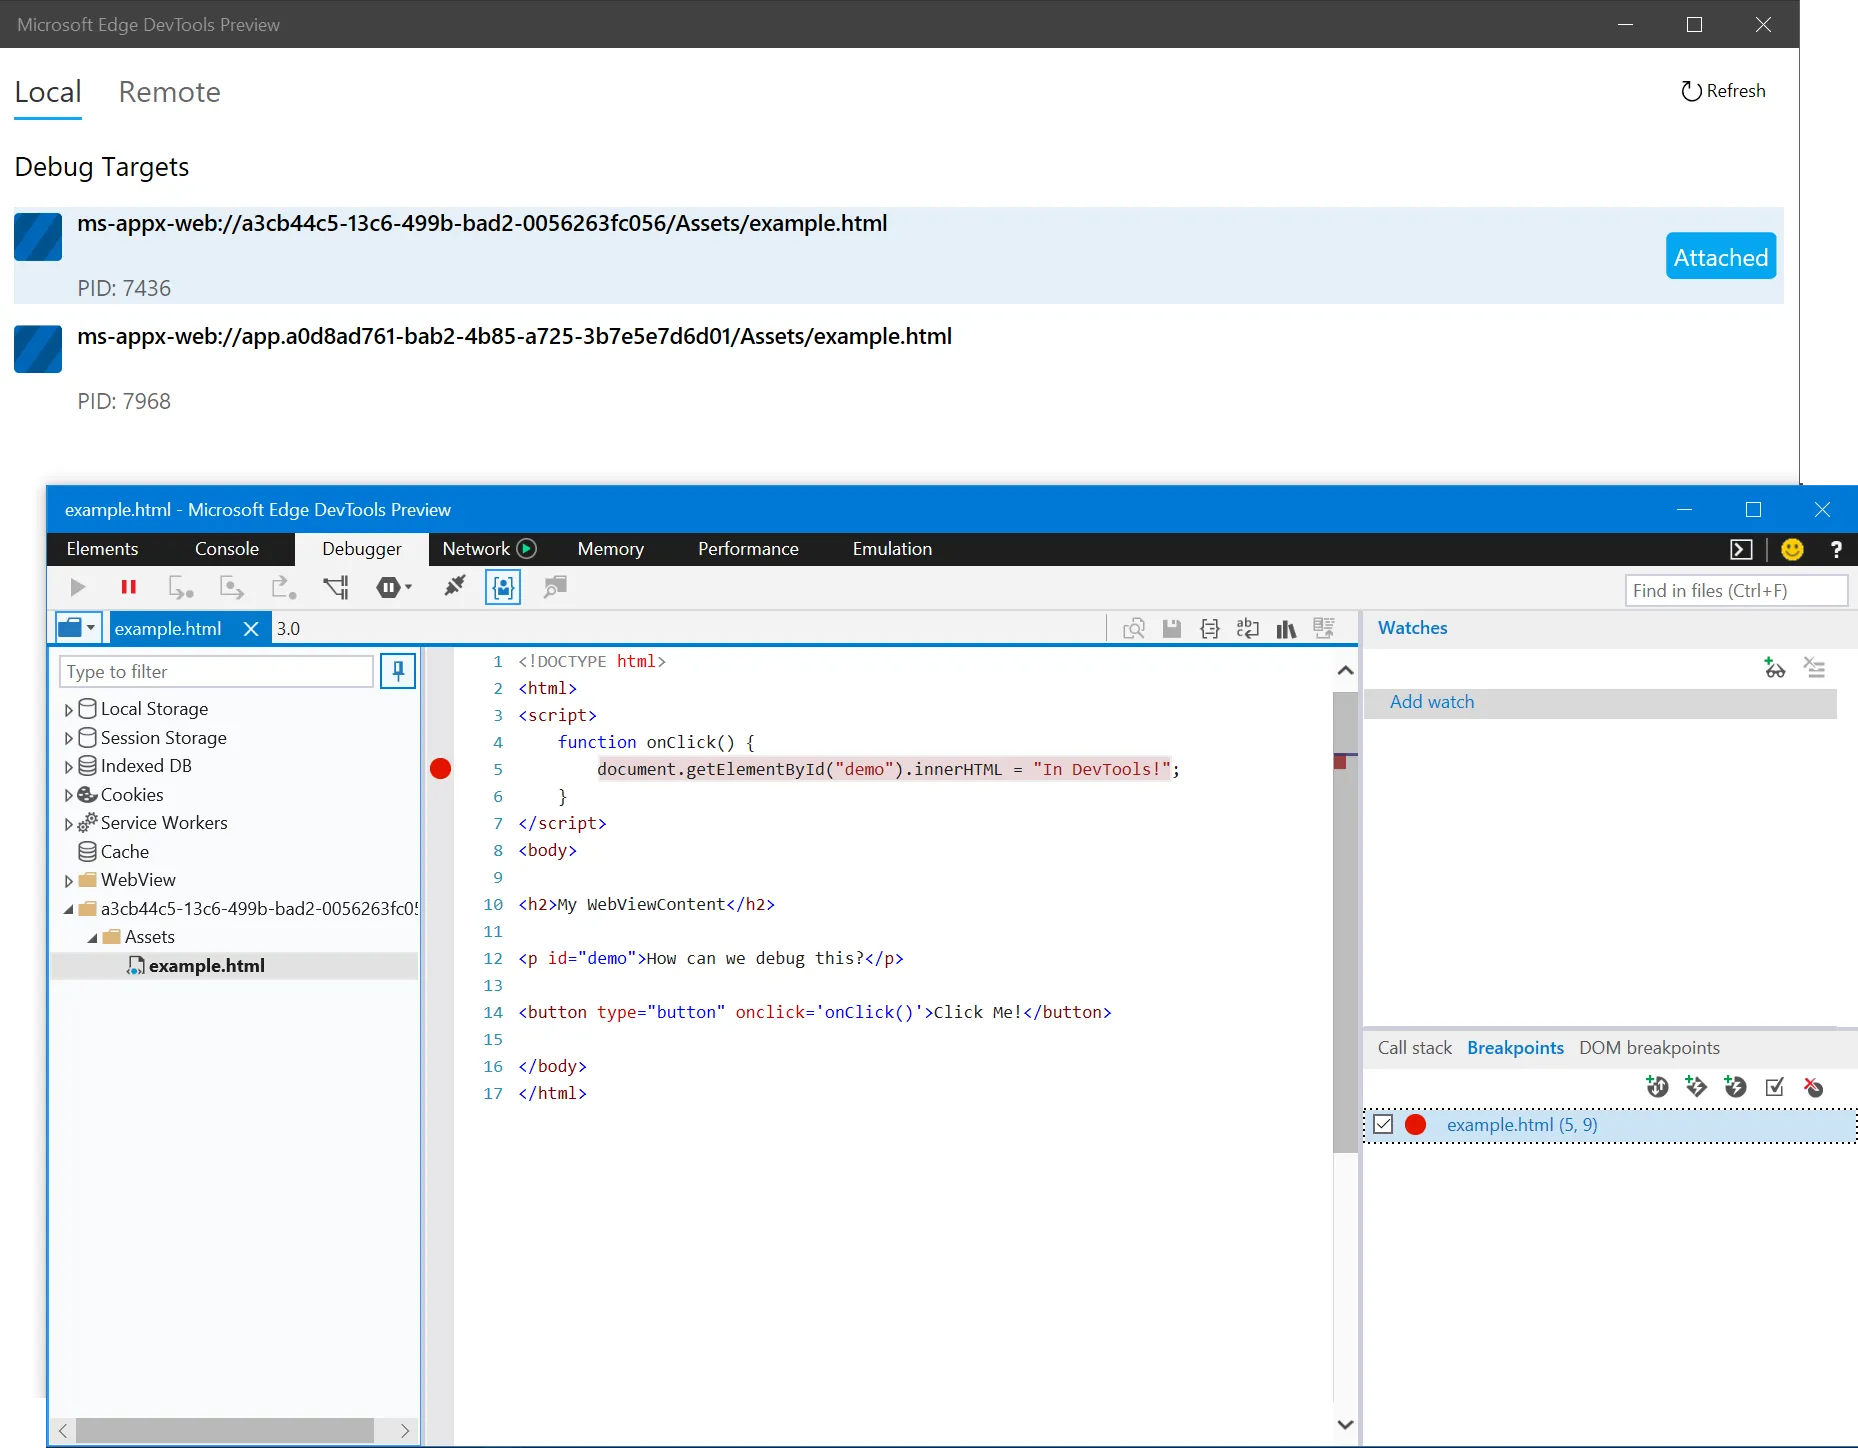
You will be presented with a list of Debug Targets. You should be able to identify your running app as soon the app displays the WebView with some content loaded. Note that you may even see it twice if you have the page containing the WebView open in the XAML Designer. This is a separate instance of the WebView, and it runs inside Visual Studio as opposed to in your app.
Click on the process entry you want to debug (located in the list), and a new window containing the debugging tools will open. In the main window of the DevTools app, the process entry will display a label indicating the developer tools are attached to the selected process.
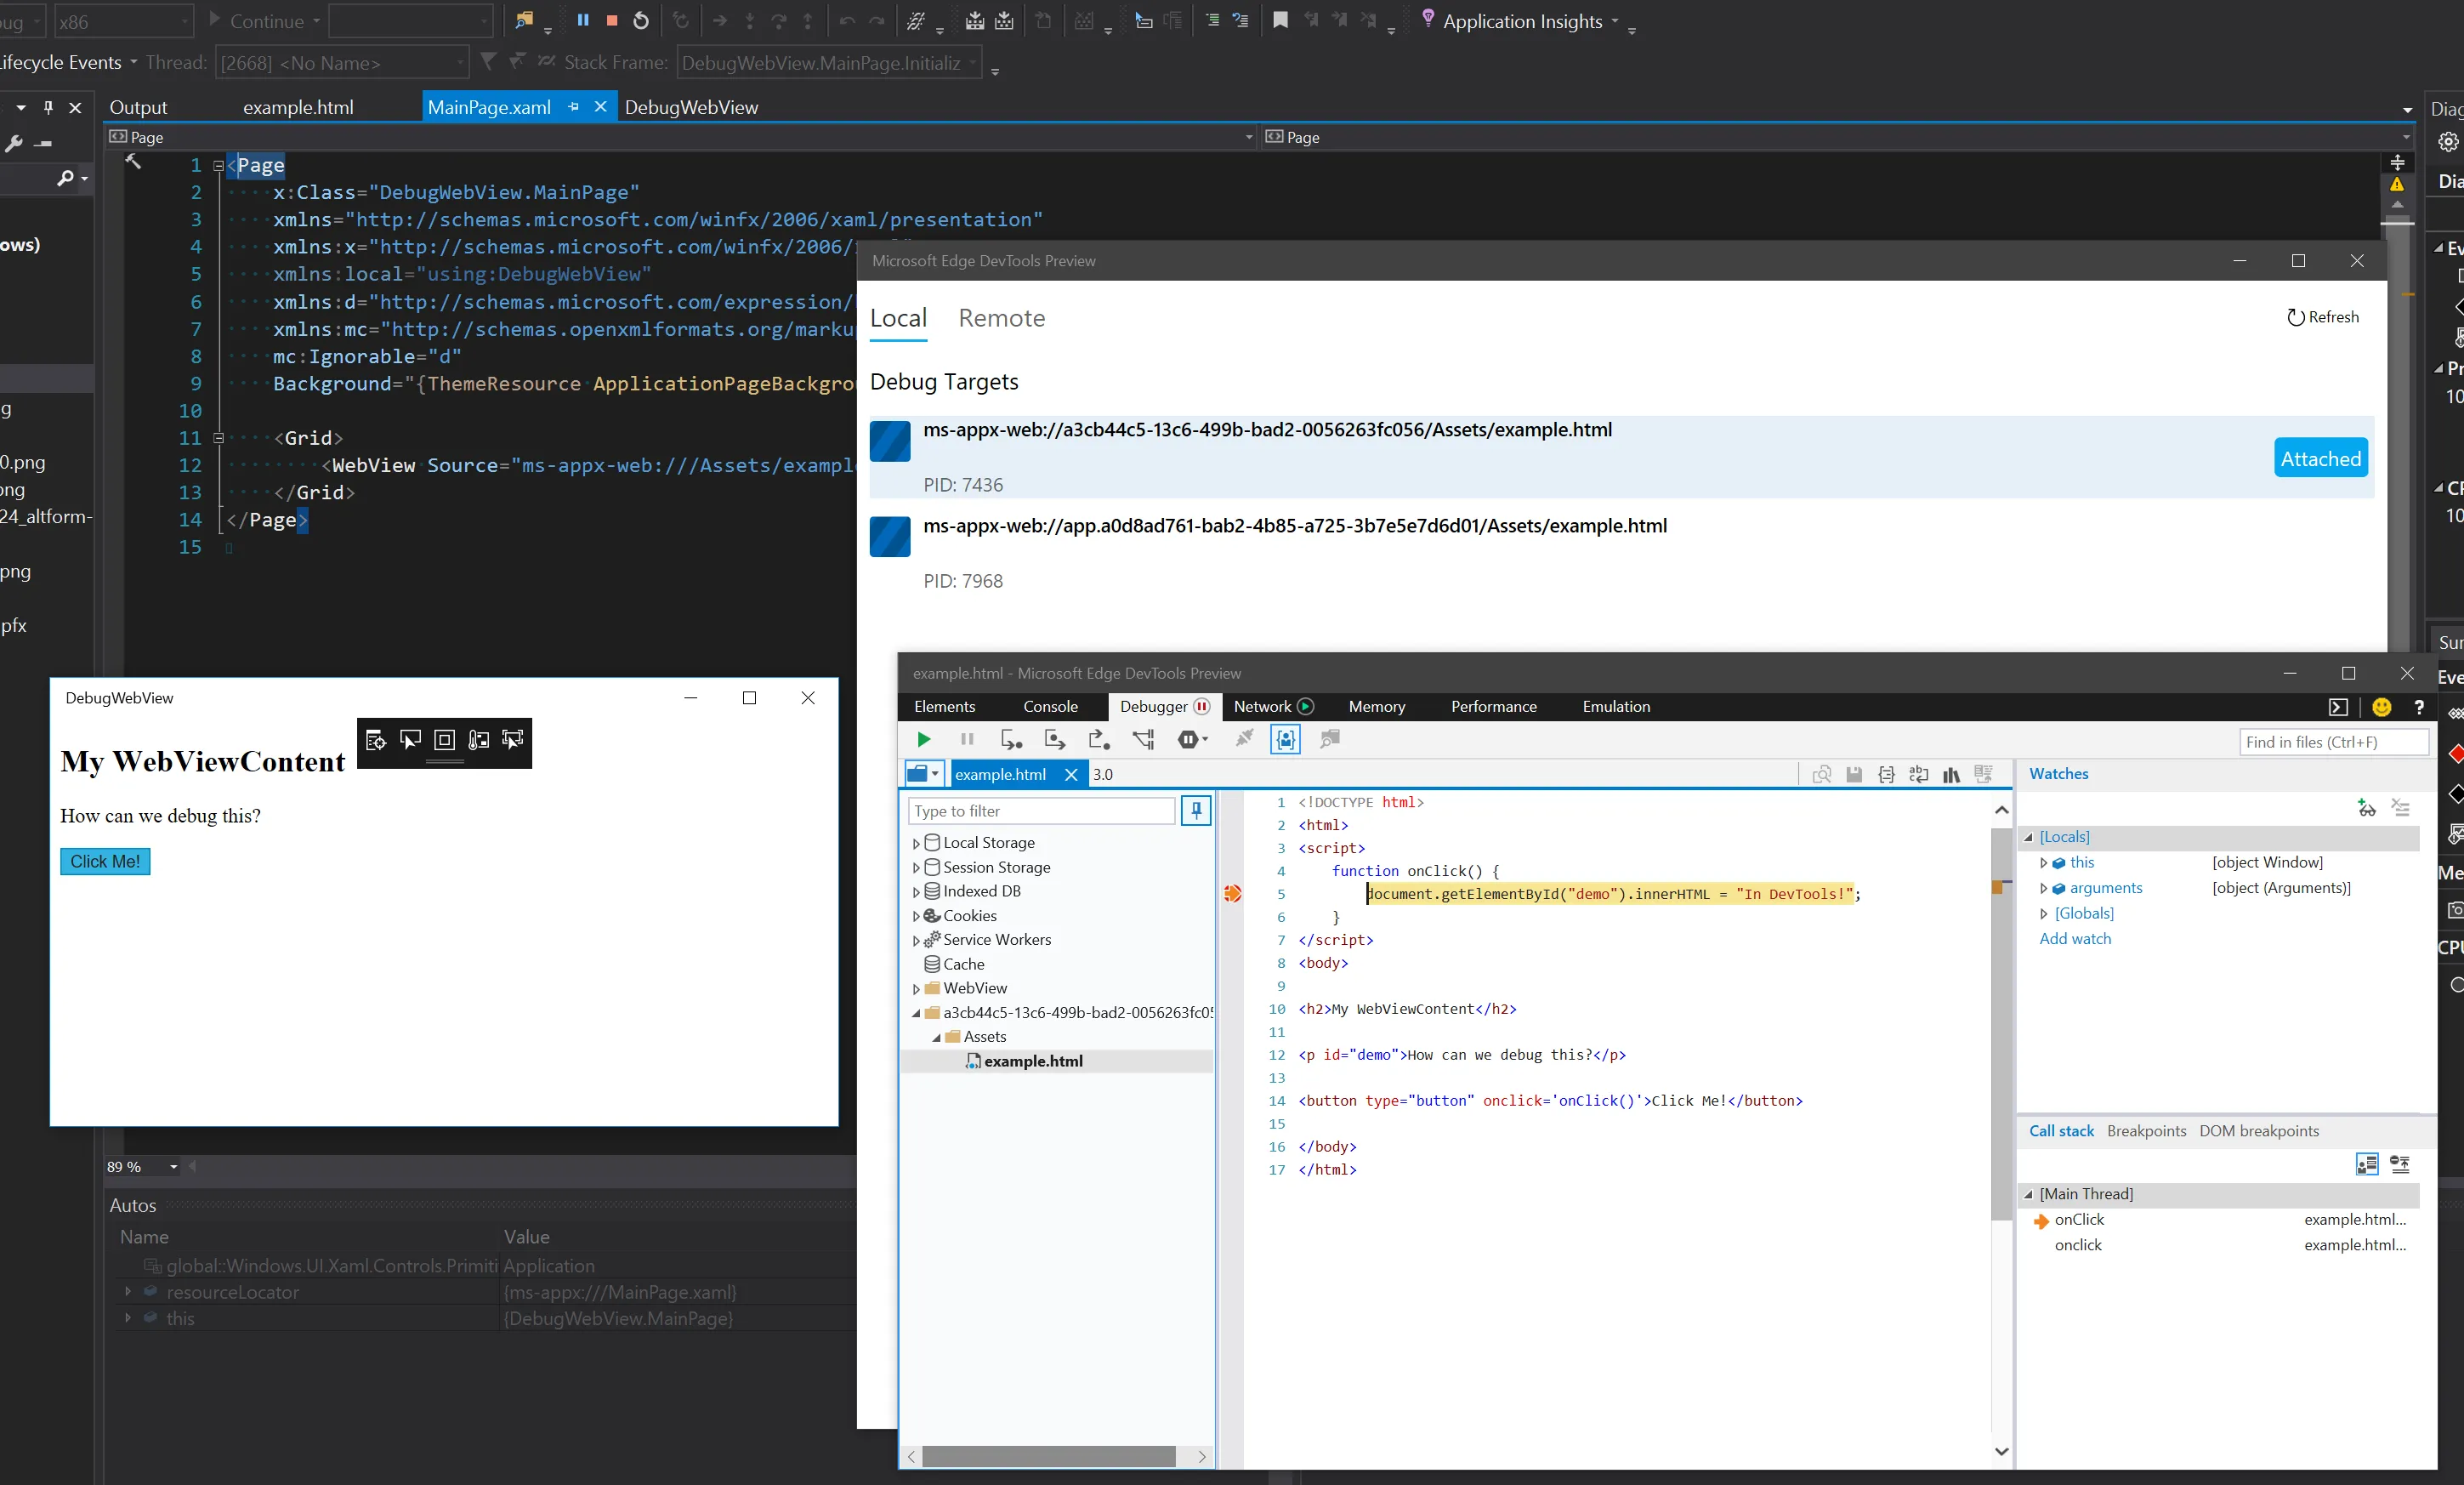
In the window containing the debugging tools attached to the process, you can set breakpoints, inspect the DOM tree, inspect CSS, and profile memory and performance. You can now also simultaneously set breakpoints in managed and native code, which is enormously helpful in situations such as debugging Windows Runtime Components that are injected into the WebView JavaScript runtime environment.
Final Thoughts
The DevTools app is still in preview, so you should expect some rough edges here and there (no pun intended). One particularly aggravating limitation right now is that there seems to be no way to get the tools to attach to the process automatically. This means you still have to rely on Script debugging in Visual Studio if you need to debug from the very first moment the WebView loads content. Hopefully Microsoft will have a solution for that by the time the tools are out of preview. Fortunately, we shouldn’t have to wait for new versions of Visual Studio to get new features for developing web content, as these tools will be updated independently.
Conclusion
Debugging your WebView-hosted content in UWP apps no longer needs to be a slow, buggy, and limited experience. The Edge DevTools Preview app relieves you of most pain points while presenting you with a more familiar set of web development tools that work well with Visual Studio debugging.


