Tackling PDF Performance Issues
Table of contents

Today’s blog post is about a performance issue we investigated recently. It shows how small changes can make a huge difference when it comes to rendering. It also talks about our integration and understanding of PDFium, both of which enable us to improve the engine and in turn provide better performance for our customers.
By the end of the post, you’ll have dipped your toes into a small part of the PDF specification, learned about some complications in PDFium, and understood how we at PSPDFKit tackle PDF performance issues.
If you don’t know what PDFium(opens in a new tab) is, it’s an open source PDF engine maintained by Google. If you’ve ever opened a PDF in Chrome, you’ve used PDFium. The Chrome browser accounts for approximately 65 percent of the world’s browser use(opens in a new tab), which gives us confidence in the stability and security of the PDFium project.
We’ve been working with PDFium for more than five years, and during that time, we’ve gained enough understanding and expertise to make low-level changes that benefit our customers. In turn, as PDFium contributors, we’re proud to say we’ve had a hand in the stability of the project.
Now to find out how we use our expertise to solve problems.
Determining the Issue
When you’ve worked with PDFs for a while, you’ll likely become familiar with the phrase, “This PDF takes too long to render.” But why does it sometimes take a long time for a PDF to render?
Because the PDF specification is so flexible, it poses a huge amount of permutations that a PDF engine has never encountered before. So when a PDF engine encounters a unique permutation, it’s highly likely the engine code has never been optimized for the given situation. That — along with large images and complicated paths — contributes to the “slow PDF” adage.
Recently, we had a support request come our way that stated a specific page of a customer’s PDF was slow to render. Given what we know about PDFs, this wasn’t too surprising. But then we were told other viewers were handling the page absolutely fine. This is rare — PSPDFKit’s performance is usually on par with or better than that of comparable readers, so it was definitely interesting.
Obviously, we can’t show the PDF here, but what you need to know is the page in question had lots of graphs, tables, and lines — all of which, in PDF land, we refer to as paths. Paths use a set of operations to describe lines and shapes that come together to represent graphs, tables, and drawings of any type.
So now we have our first hint: paths. But that doesn’t give us too much information. So how do we dig deeper?
Diagnosing the Issue
At PSPDFKit, most of the core code is written in C++. So to diagnose a performance issue, the best way is to perform the operation in C++ and use a profiler.
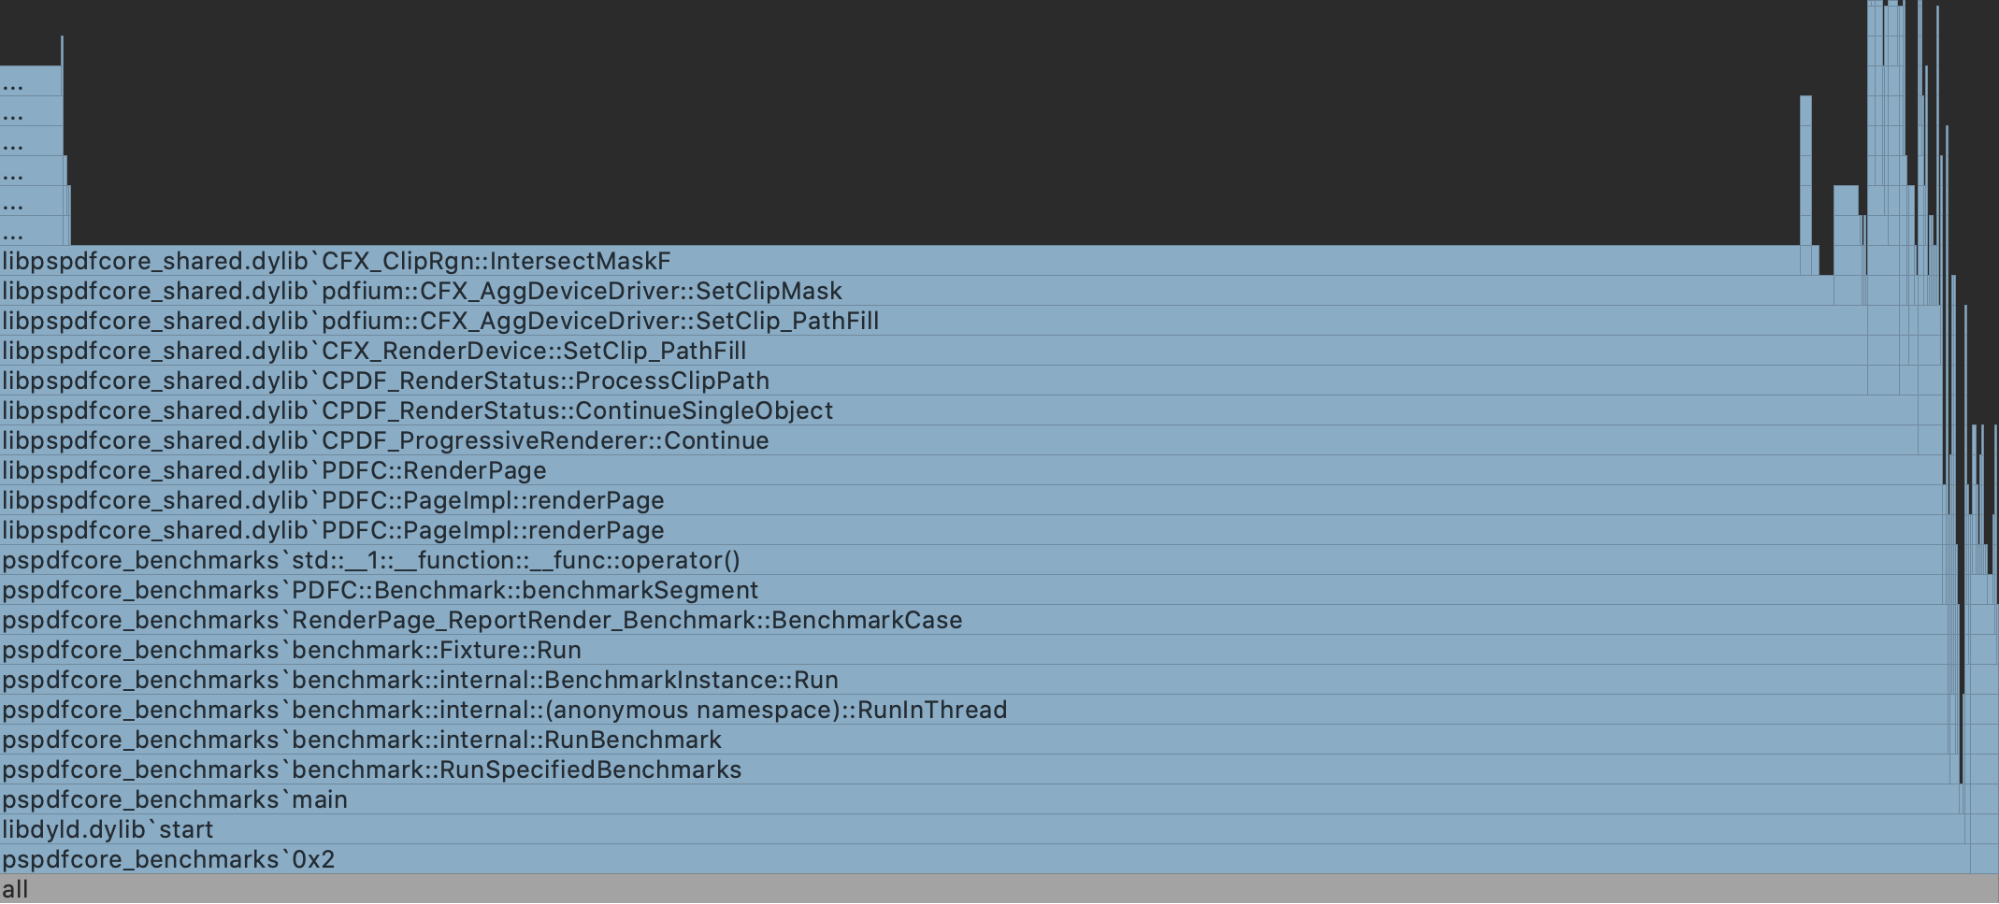
I use CLion on macOS, which uses dtrace(opens in a new tab) behind the scenes. So I threw together a quick benchmark that rendered the page in question and ran the profiler there.

It should be pretty obvious from the flare chart above that we found the culprit, or at least the hotspot: CFX_ClipRgn::IntersectMaskF(opens in a new tab) is a method in PDFium that takes a rendered region and clips it based upon some mask. So the question was, why was it taking so long?
Digging further, I found that a newly clipped bitmap was being created many times over(opens in a new tab). At this point, I began worrying we were out of luck, especially because we already apply mask caching in this area.
It’s logical to ask “how” the clipping region is being created. The PDF spec describes the region with the use of paths, which was alluded to in the beginning. Following this train of thought unearthed some interesting findings.
CFX_AggDeviceDriver::SetClip_PathFill(opens in a new tab) was being called (note we’re back to paths again) with six point operations, but when I looked at these closer, the points seemed to be describing a square. Six points to describe a square seems a bit wasteful.
Why So Slow?
When looking through CFX_AggDeviceDriver::SetClip_PathFill(opens in a new tab), I found that paths with four or five points were checked to see if they represent a rectangle, and if they did, they were heavily optimized.
Masks of rectangles are much easier to apply than those of an arbitrary shape. Just taking a visual diff of CFX_ClipRgn::IntersectRect(opens in a new tab) versus CFX_ClipRgn::IntersectMaskF(opens in a new tab) gives us a good clue as to the complexity of an arbitrarily shaped mask.
Additionally, CFX_ClipRgn::IntersectMaskF(opens in a new tab) shows multiple allocations of bitmaps (large buffers), which most likely contributed to the largest slowdowns we were seeing. In comparison, CFX_ClipRgn::IntersectRect(opens in a new tab) performed zero allocations, so it was obvious we wanted to use this code path whenever possible.
How We Fixed It
Finding a fix was pretty simple. We optimized the paths prior to use, which enabled us to take the CFX_ClipRgn::IntersectRect(opens in a new tab) code path:
0 792 m0 792 l0 12 l595 12 l595 792 l0 792 lhThe above is an example of a path operation taken from the problematic PDF page. What’s important to know here is each line is a path operation; the numbers represent X, Y positions on the page; m represents a move of the cursor to a location; and l draws a line to the given location.
Looking at the first two operations, we have a move to 0 792, and then from that point, we draw a line to 0 792. Well, that’s a waste of time, especially when we have subsequent lines drawn. So here’s one optimization: Remove the redundant line operation.
You may have also noticed the h at the end. This operation instructs the path to close the shape and draw a line back to the original location — 0 792 in this instance. But notice that the last operation, 0 792 l, already draws a line back to the original location. So there’s another wasted operation.
If we were to optimize this path, it could look like the following:
0 792 m0 12 l595 12 l595 792 lhOur in-memory representation of the operations is optimized in the same way.
Four operations (discounting the closing of the shape)! Now we can take the optimized CFX_ClipRgn::IntersectRect!
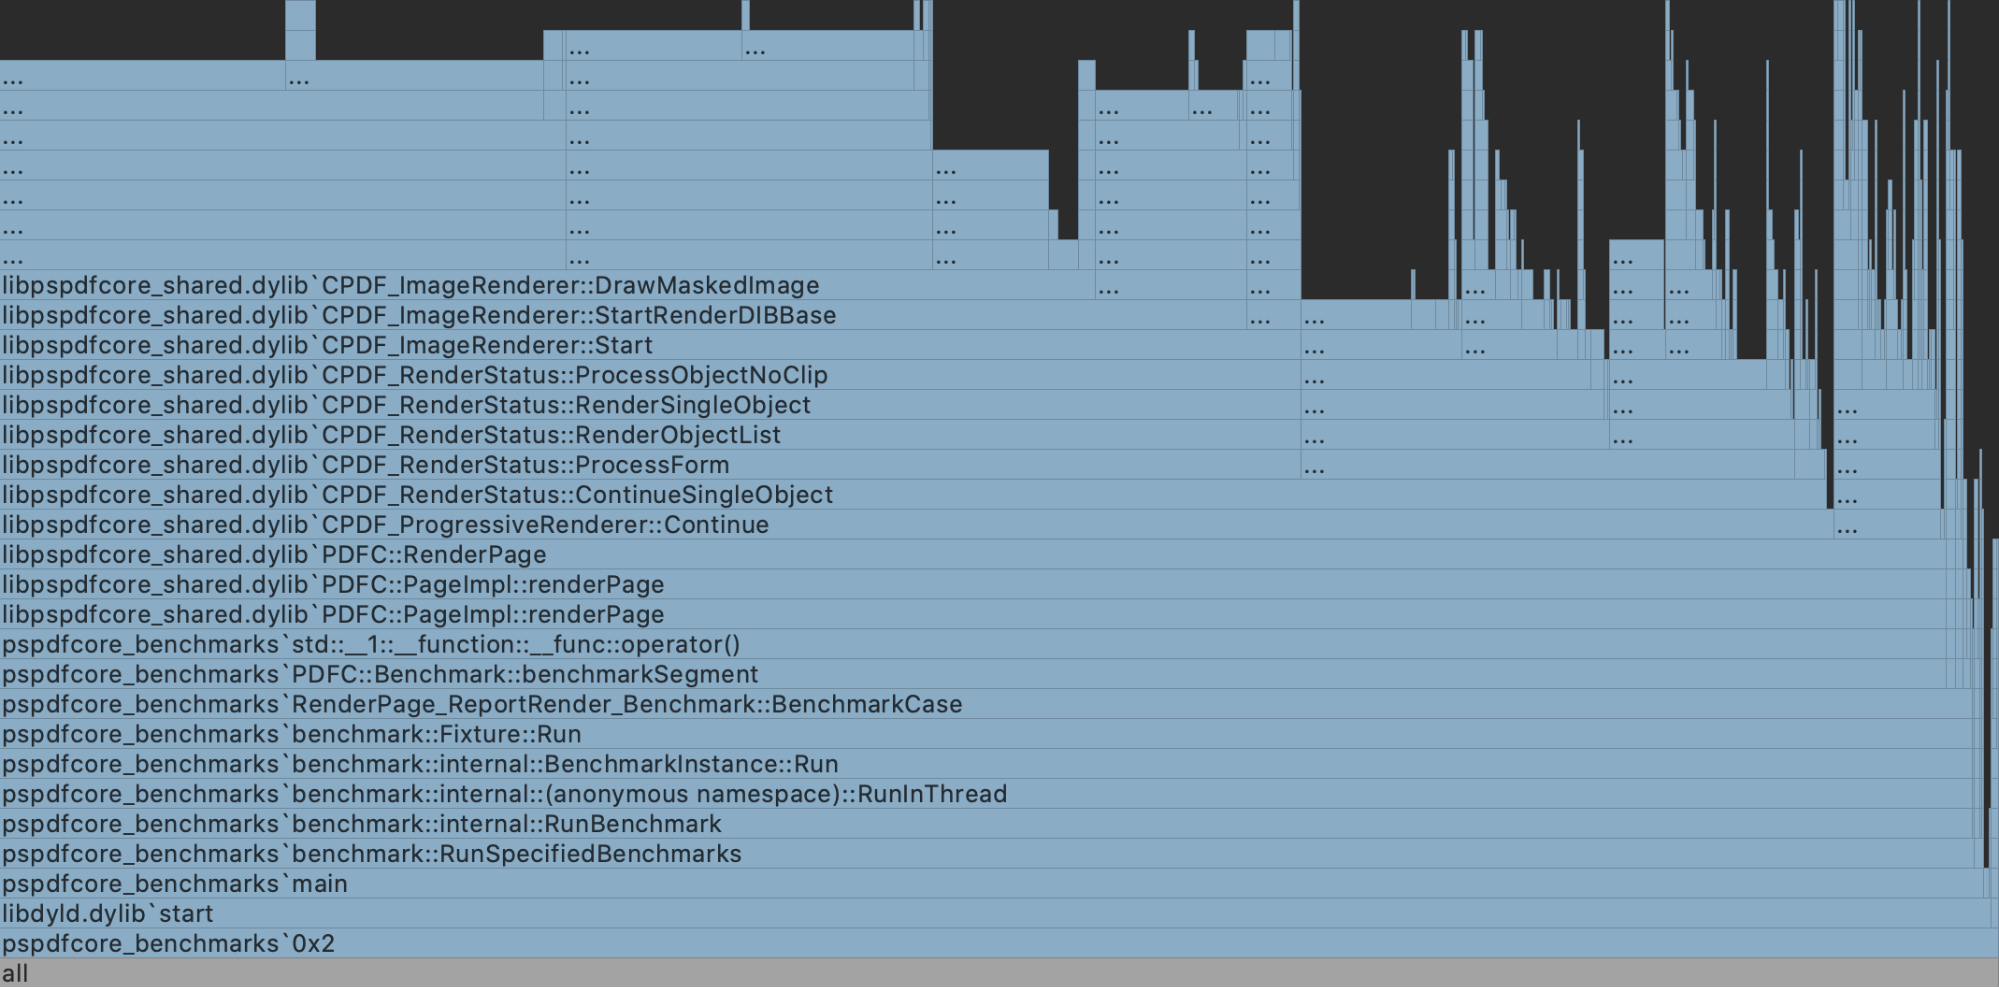
I won’t bore you with the C++ code, but I will show you the flare chart after these optimizations.

Any mention of setting the clipping mask all but disappeared, but that didn’t give us an indication of a performance increase, so we measured the benchmarks.
Rendering on macOS went from 1256 ms, all the way down to 238 ms. I’ll take that.
The great thing is the optimizations don’t stop with masks; they also apply to any path drawing. And there were other potential unoptimized path sets we identified while investigating this issue, meaning we saw speed increases in other areas too!
Summary
In the end, the specific PDF was fairly unusual with the way it described paths. And ultimately, we have no idea what the source of the PDF was or why it chose to insert redundant path operations when they weren’t required.
But with a little bit of digging and a large amount of patience, it was possible to unpick the PDF pieces and find huge gains. Not every performance investigation turns out this way, but it sure is nice when they do!


